Table of Contents
How do I open a case with AppDynamics Support?
First, ensure you can access Cisco SCM with a valid Cisco.com account. If you were part of the migration this should have been done automatically. If you still need to request a Cisco.com account, please refer to the earlier communication about User Identity changes found here.
Make your way to the AppDynamics portal on appdynamics.com/support. When you log in to the AppDynamics portal you will be automatically redirected to Cisco SCM.
Case Opening: When there is only one AppDynamics Subscription associated with the User (most cases)
- Navigate to the AppDynamics Portal Link to the Support section (see Figure 1) and click the link “Open a new ticket”.

Figure 1
- You will be taken directly to the “Describe problem page” where you will be prompted to enter details of the incident reported (Figure 2). Proceed to select a pre-set sub technology by clicking the “Manually Select a Technology” button.

Figure 2
-
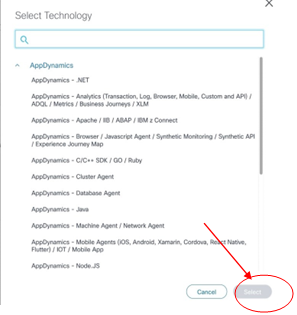
Choose the Technology that most closely relates to the issue and click the “Select” button.

Figure 3
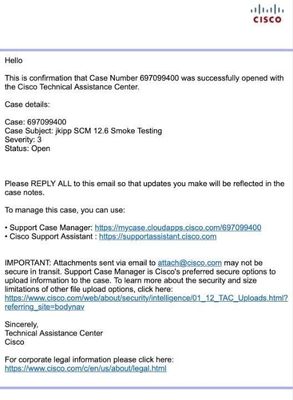
- After you submit the case, the system asks if you’d like to receive e-mail updates with details of the ticket and choose to opt in or out (Figure 4).


Figure 4
Case Opening: When there are multiple subscriptions associated with a user
- Follow the same steps as in the “Case Opening procedure with one subscription associated with a user”, by going to the AppDynamics Portal Link to Support (see Figure 1) and clicking the link to “OPEN SUPPORT TICKETS”.
- If there are multiple subscriptions associated with your account, choose the correct subscription number from the menu (Figure 5) then click the “Next” button.

Figure 5
- SCM detects you being associated with AppDynamics only and reduces the Tech and Sub-Tech to AppDynamics choices (Figure 3).
- After you submit the case and if opting for such, the system automatically sends an e-mail with details of the ticket, pointing to the newly opened case in SCM for case management (Figure 4).
Case severity
In conjunction with the migration to Cisco SCM, AppDynamics customers will be making use of the Case severity definition as determined by Cisco in the table below.
|
Case Severity
|
Description
|
|
Severity 1 (S1)
|
Critical impact on the customer’s business operations. Cisco’s hardware, software, or as a service product is down.
|
|
Severity 2 (S2)
|
Substantial impact on the customer’s business operations. Cisco hardware, software, or as a service product is degraded.
|
|
Severity 3 (S3)
|
Minimal impact on the customer’s business operations. Cisco hardware, software, or as a service product is partially degraded.
|
|
Severity 4 (S4)
|
No impact on the customer’s business operations. The customer requests information about features, implementation, or configuration for Cisco’s hardware, software, or as a service product.
|
Note! Post-migration, some functions will be limited. These include:
- All open tickets will be migrated to the new system (you will receive a notification with the new case ID).
- All tickets closed on or later than May 14th will be available in the new system (you will receive a notification with the new case ID)
Why am I not getting Support Case notifications/emails?
Often, case notifications are turned off because users miss setting Case Notifications to "On" while opening a case. As the case creator, you have the ability to enable/disable notifications from the Support Case Manager (SCM) user interface. Enabling notifications ensures that our support engineers' responses are also received via email.
Understanding Case Notifications:
- Case Notifications On: You will receive email updates about the case.
- Case Notifications Off: You will not receive email updates.
In this scenario, you need to check the Support Case Manager for updates:
- Go to Support Case Manager
- Navigate to Individual case details -> Notes section
- Alternatively, by using our Cisco Support Assistant bot.
How to Enable Notifications
1. Global Configuration:
- Go to SCM -> Settings (Gear icon in the top right corner)
- Note: Global notifications settings have Case Notifications turned off by default. We recommended customers to set this to On at global level.
2. Per-Case Basis:
- You can also enable notifications on a per-case basis during case creation.
Different Case Opening Paths
From Account Portal:
- Opening a case from the Account Portal -> Open new ticket will set the case notifications to "On."
From Support Case Manager:
- Opening a case from the Support Case Manager -> Open a new case will respect the global notifications settings mentioned above
- Via appd-support@cisco.com -> Case notifications will be "Off" . This does not respect global settings from SCM.
Adjusting Notifications After Case Creation
You can always turn case notifications on/off after opening the case and before the case closure:
- Navigate to Support Case Manager
- Scroll down to Case Notifications and click "Edit."
- You can also request the support engineers to enable/disable the case notifications by responding to the case, and they will do it for you.
Video Tutorials
How to open a support case
How to navigate and view filed support cases
Additional Resources
