Resolved! How to show calls in different granularity's
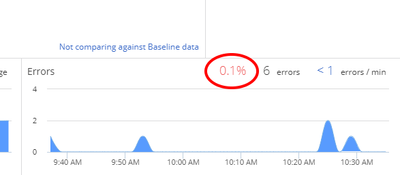
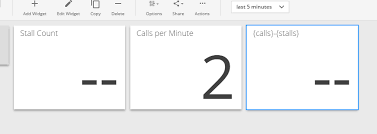
Hi ! I have a client that wants to be able to see the number of requests (or calls) on different time ranges, but I can only create graphics with the "calls/min" metric. Is there a way to either aggregate the data of that Metric to have calls for sp...