- Community Hub
- Forum Q&A
- Business iQ (Analytics)
- Controller (SaaS, On Premise)
- Dashboards
- Dynamic Languages (Node.JS, Python, PHP, C/C++, Webserver Agent)
- End User Monitoring (EUM)
- Infrastructure (Server, Network, Database)
- Java (Java Agent, Installation, JVM, and Controller Installation)
- Licensing (including Trial)
- .NET (Agent, Installation)
- Smart Agent
- General Discussions
- Resources
- Groups
- Idea Exchange
Not a customer? Click the 'Start a free trial' link to begin a 30-day SaaS trial of our product and to join our community.
Existing Cisco AppDynamics customers should click the 'Sign In' button to authenticate to access the community
- Cisco AppDynamics Community
- Forums Q&A
- Dashboards
- No data Avaliable in dashboard
- Subscribe to RSS Feed
- Mark Topic as New
- Mark Topic as Read
- Float this Topic for Current User
- Bookmark
- Subscribe
- Mute
- Printer Friendly Page
- Mark as New
- Bookmark
- Subscribe
- Mute
- Subscribe to RSS Feed
- Permalink
- Report Inappropriate Content
12-13-2023 03:27 AM
1.Validate the Cluster Agent Installation
2.we have deployed appdynamics using EKS on AWS
3.we have succefully deployed it using helm chart
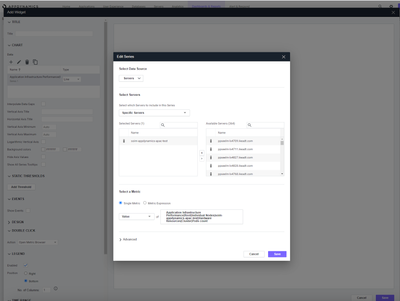
4.but in the dashboard it says no data available
5.We have installed cluster agent and Visibility infra using the above documentation and we are not able to get the visual data in the console and in the metrics browser it just says no data available.
We are using EKS cluster 1.25 version with 2 nodes and we have deployed bank-of-anothos application in our cluster
6.# To install InfraViz
installInfraViz: true
# AppDynamics controller info
controllerInfo:
url: https://cat202312051119163.saas.appdynamics.com:443
account: My account name
username: My username
password: My password
accessKey: my access key
globalAccount: my account name
# Infra Viz config
infra Viz:
nodeOS: "linux"
enableMasters: true
stdoutLogging: true
enableContainerHostId: true
enable Server viz : true
enable Docker viz : false
# Net viz config
net Viz:
enabled: true
net Viz Port: 3892
screenshot link:
Screenshot 2023-12-13 at 3.07.16 PM.png
Please tell Work around for above issues.
Thanks
Solved! Go to Solution.
- Mark as New
- Bookmark
- Subscribe
- Mute
- Subscribe to RSS Feed
- Permalink
- Report Inappropriate Content
12-13-2023 09:56 AM
Hi @tharun.santosh,
I see you posted your question again. The community is a peer-to-peer community. I suggest you try contacting AppD sales for further help.
https://www.appdynamics.com/company/contact-us
Thanks,
Ryan, Cisco AppDynamics Community Manager
Found something helpful? Click the Accept as Solution button to help others find answers faster.
Liked something? Click the Thumbs Up button.
Check out Observabiity in Action
new deep dive videos weekly in the Knowledge Base.
- Mark as New
- Bookmark
- Subscribe
- Mute
- Subscribe to RSS Feed
- Permalink
- Report Inappropriate Content
12-13-2023 09:51 PM
Hello Ryan,
I understood that I have posted another questions for the same problem, I am trying to contact Bangalore India, AppD sales no response from their side. Could you please suggest any contact Email Id of technical support team so that we will discuss whether the issue is with our configurations or there are any limitations in pro trial version.
We are running our applications in EKS cluster but in trial version documentation it has given that we can access all the services for 15-days. But all the configurations are made according to the documents, After in dashboard the data's are not reflecting, Could you please suggest work around for this problem.
thanks,
tharun
- Mark as New
- Bookmark
- Subscribe
- Mute
- Subscribe to RSS Feed
- Permalink
- Report Inappropriate Content
12-14-2023 10:19 AM
Hi @tharun.santosh,
Unfortunately, Support is only available to customers with a paid license, which is why I suggested filling out that form and getting in touch with Sales. I don't know what their SLA is with a follow-up.
Thanks,
Ryan, Cisco AppDynamics Community Manager
Found something helpful? Click the Accept as Solution button to help others find answers faster.
Liked something? Click the Thumbs Up button.
Check out Observabiity in Action
new deep dive videos weekly in the Knowledge Base.
- Mark as New
- Bookmark
- Subscribe
- Mute
- Subscribe to RSS Feed
- Permalink
- Report Inappropriate Content
12-14-2023 01:23 PM - edited 12-14-2023 01:25 PM
Hi @tharun.santosh ,
Please use the relative path in the Dashboard setting. Please try this path
Please use Hardware Resources|Cluster|Pods count for value in above screenshot. Seems like you are using some incorrect path in path as in the above screenshot. Please use "Hardware Resources|Cluster|Pods count"
Relative path documentation
Thanks,
Satbir
Learn how Splunk and AppDynamics are redefining observability
Watch Now!
Dive into our Community Blog for the Latest Insights and Updates!
Read the blog here

Thank you! Your submission has been received!
Thank you! Your submission has been received!
Oops! Something went wrong while submitting the form
