- Community Hub
- Forum Q&A
- Business iQ (Analytics)
- Controller (SaaS, On Premise)
- Dashboards
- Dynamic Languages (Node.JS, Python, PHP, C/C++, Webserver Agent)
- End User Monitoring (EUM)
- Infrastructure (Server, Network, Database)
- Java (Java Agent, Installation, JVM, and Controller Installation)
- Licensing (including Trial)
- .NET (Agent, Installation)
- Smart Agent
- General Discussions
- Resources
- Groups
- Idea Exchange
Not a customer? Click the 'Start a free trial' link to begin a 30-day SaaS trial of our product and to join our community.
Existing Cisco AppDynamics customers should click the 'Sign In' button to authenticate to access the community
- Cisco AppDynamics Community
- Forums Q&A
- EUM
- Re: How to export the status code and ajax error c...
- Subscribe to RSS Feed
- Mark Topic as New
- Mark Topic as Read
- Float this Topic for Current User
- Bookmark
- Subscribe
- Mute
- Printer Friendly Page
How to export the status code and ajax error code from browser snapshot data for analytics purpose?
- Mark as New
- Bookmark
- Subscribe
- Mute
- Subscribe to RSS Feed
- Permalink
- Report Inappropriate Content
08-10-2021 08:20 PM - last edited on 09-21-2021 09:40 AM by Ryan.Paredez
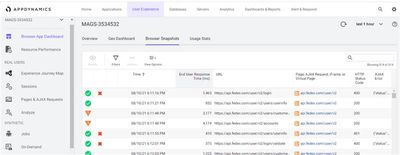
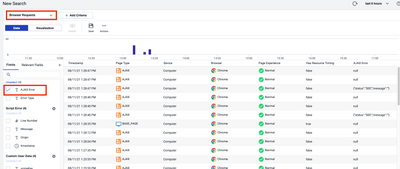
I am trying to export the status code and ajax error code in user experience from browser snapshot data of respective requests for our analytics purpose? Is there any way to do this?
I tried with multiple options but am not sure how will be able to export these.
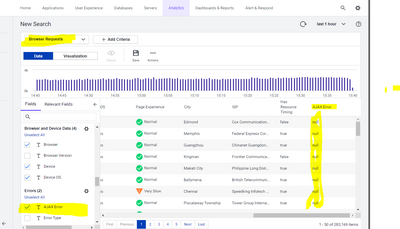
I have used analytics API as an alternative to fetch these values but I see ajax error value is always captured null for all the requests on the analytics level.
You can see above our requirement is to just capture this status code and ajax error code for the respective API.
Please help me with this.
- Mark as New
- Bookmark
- Subscribe
- Mute
- Subscribe to RSS Feed
- Permalink
- Report Inappropriate Content
08-11-2021 01:37 AM - last edited on 09-02-2021 09:44 AM by Ryan.Paredez
- Mark as New
- Bookmark
- Subscribe
- Mute
- Subscribe to RSS Feed
- Permalink
- Report Inappropriate Content
08-11-2021 03:17 AM - last edited on 09-02-2021 09:44 AM by Ryan.Paredez
Hi Team,
I have followed the steps that you have provided, however, I can see the Null value is only captured for Ajax error that is not correct.
Could you please guide me further in order to get the correct value of the Ajax error?
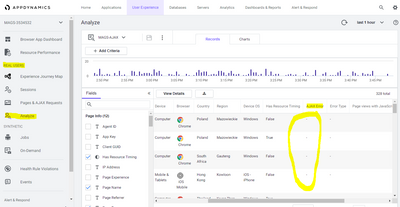
I have noticed one more thing all this analytics level data is sync with REAL USER -Analyze tab. As you can see we are capturing nothing here ajax error in the real user tab so my question remains the same is there any way so that Ajax error we would be able to capture.
In case if some configuration mistake we are doing from our end on the end-user experience level please guide me for those as well so that we will correct those and will start capturing those data(Ajax error).
As I see in the screenshot shared by you that you are able to capture that Ajax error. It would be really helpful if you can share your configuration for monitoring the end-user so that we will be also doing the same.
Thanks and Regards,
Dhiraj Kumar
^ Edited by @Ryan.Paredez to remove PII. Please do not leave your phone number on community posts. I would recommend sharing that as a private message with someone if you two decide to communicate that way.
- Mark as New
- Bookmark
- Subscribe
- Mute
- Subscribe to RSS Feed
- Permalink
- Report Inappropriate Content
08-12-2021 01:01 AM - last edited on 09-02-2021 09:44 AM by Ryan.Paredez
Hi @Dhiraj.Choudhary ,
Thank you for checking the analytics data.
Could you please check below?
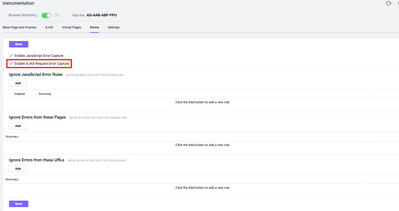
- Please confirm "Enable AJAX Request Error Capture" check box for Error Detection Rules is enabled.
You can access Error Detection Rules from browser application->Configuration->Instrumentation->Errors tab
https://docs.appdynamics.com/21.8/en/end-user-monitoring/browser-monitoring/browser-real-user-monito...
I think this is enabled because you can see Ajax Error from browser snapshots, but I'm asking just to be sure.
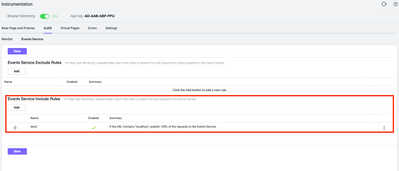
- Please confirm if there are any rules for "Events Service Include Rules" for AJAX Events Service setting. If there are no rules, please add rules in order to publish the AJAX request to Event Service(Analytics).
You can access AJAX Events Service setting from browser application->Configuration->Instrumentation->Ajax tab->Events Service tab.
By default, there may be no rule, and if no rules are specified, no data on Ajax requests is sent to analytics.
https://docs.appdynamics.com/21.3/en/end-user-monitoring/browser-monitoring/browser-real-user-monito...
After adding include rules, please check Analyze page by filtering Page Type by AJAX and see if there is any record for AJAX requests.
Best Regards,
Hiroki
- Mark as New
- Bookmark
- Subscribe
- Mute
- Subscribe to RSS Feed
- Permalink
- Report Inappropriate Content
08-12-2021 07:22 AM - last edited on 09-02-2021 09:45 AM by Ryan.Paredez
Hi Team,
Thank you!! for you valuable comments We are able to get Ajax error in Analytics as I have tweaked some configuration based on your input and official documentation.
I was stuck on below points as we are in the process of enhancing health rule based on capability that AppDynamics can provide :
1.Just wanted to check if there is any way we can configure the health rule on AppDynamics level where we can send the alert only when we get 500 series Ajax error. As those are the critical one and we need immediate attention.
2.If we need to configure health rule for JavaScript error on browser level (for example if we want to send the alert if java script error occurs on IE browser)is there any way for that.
It would be really help full for us .if you can provide some insight on above query.
Thanks and Regards,
Dhiraj Kumar
- Mark as New
- Bookmark
- Subscribe
- Mute
- Subscribe to RSS Feed
- Permalink
- Report Inappropriate Content
08-13-2021 01:24 AM - last edited on 09-02-2021 09:45 AM by Ryan.Paredez
Hi @Dhiraj.Choudhary ,
Great to hear you could get Ajax error in Analytics.
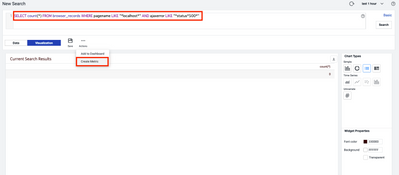
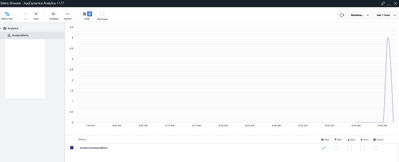
1. You can create an Analytics metric from ADQL and monitor it with a health rule.
e.g.
ADQL like below will make a metric for the number of 500 Ajax error for XXX url. By making a health rule that becomes critical once the metric value exceeds 1, you may be able to monitor the number of 500 Ajax error.
SELECT count(*) FROM browser_records WHERE pagename LIKE "XXX" ajaxerror LIKE "*status*500*"
2. JavaScript error may be available in analytics too, so you can create a custom metric and monitor it.
You can search JavaSciprt error with ADQL like below.
SELECT count(*) FROM browser_records WHERE scripterrordata.message IS NOT NULL.
https://docs.appdynamics.com/21.8/en/analytics/using-analytics-data/visualize-javascript-errors
Best Regards,
Hiroki
- Mark as New
- Bookmark
- Subscribe
- Mute
- Subscribe to RSS Feed
- Permalink
- Report Inappropriate Content
08-16-2021 04:58 AM - last edited on 09-02-2021 09:45 AM by Ryan.Paredez
Thank you for the response really helped a lot!!
Just one question could you help me with the way configure health rules with specific http error code ,Ajax error from EUM.
It would be really help full if you will provide steps by steps way to do the same with screenshot.
- Mark as New
- Bookmark
- Subscribe
- Mute
- Subscribe to RSS Feed
- Permalink
- Report Inappropriate Content
08-16-2021 06:08 PM - last edited on 09-02-2021 09:45 AM by Ryan.Paredez
Hi @Dhiraj.Choudhary ,

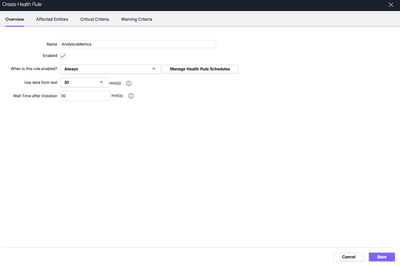
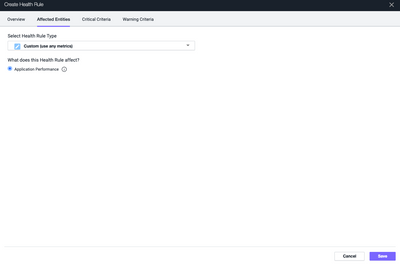
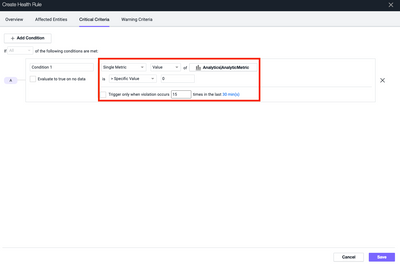
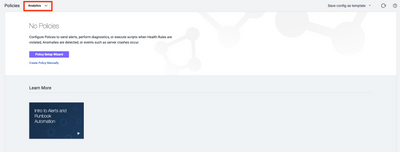
- Mark as New
- Bookmark
- Subscribe
- Mute
- Subscribe to RSS Feed
- Permalink
- Report Inappropriate Content
08-18-2021 08:59 AM - last edited on 09-02-2021 09:46 AM by Ryan.Paredez
Hi Team,
Thank you Very much !!
Is there a way to capture the JavaScript error from analytics and create the health rule based on that and send the alerts if that occurs to user?
Please help as we are struggling for the same.
Thanks,
Dhiraj Kumar
- Mark as New
- Bookmark
- Subscribe
- Mute
- Subscribe to RSS Feed
- Permalink
- Report Inappropriate Content
08-20-2021 01:05 AM - last edited on 09-02-2021 09:46 AM by Ryan.Paredez
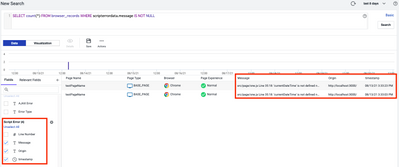
SELECT count(*) FROM browser_records WHERE scripterrordata.message IS NOT NULL

Join us on Feb 26 to explore Splunk AppDynamics deployment strategies, SaaS models, agent rollout plans, and expert best practices.
Register Now
Dive into our Community Blog for the Latest Insights and Updates!
Read the blog here
- ClassNotFoundException: com.appdynamics.apm.appagent.api.NoOpInvocationHandler in Java (Java Agent, Installation, JVM, and Controller Installation)
- Get a full URL of a slow Transaction Snapshot in NET (Agent, Installation)
- Events service shows critical after fresh installation in Controller (SaaS, On Premises)
- Starting Events Service cluster in Business iQ (Analytics)

Thank you! Your submission has been received!
Thank you! Your submission has been received!
Oops! Something went wrong while submitting the form
