- Community Hub
- Forum Q&A
- Business iQ (Analytics)
- Controller (SaaS, On Premise)
- Dashboards
- Dynamic Languages (Node.JS, Python, PHP, C/C++, Webserver Agent)
- End User Monitoring (EUM)
- Infrastructure (Server, Network, Database)
- Java (Java Agent, Installation, JVM, and Controller Installation)
- Licensing (including Trial)
- .NET (Agent, Installation)
- Privacy and Security
- Smart Agent
- General Discussions
- Resources
- Groups
- Idea Exchange
Not a customer? Click the 'Start a free trial' link to begin a 30-day SaaS trial of our product and to join our community.
Existing Cisco AppDynamics customers should click the 'Sign In' button to authenticate to access the community
- Cisco AppDynamics Community
- Forums Q&A
- Dashboards
- Re: Node flow map explanation
- Subscribe to RSS Feed
- Mark Topic as New
- Mark Topic as Read
- Float this Topic for Current User
- Bookmark
- Subscribe
- Mute
- Printer Friendly Page
- Mark as New
- Bookmark
- Subscribe
- Mute
- Subscribe to RSS Feed
- Permalink
- Report Inappropriate Content
11-08-2022 04:49 PM
Hello,
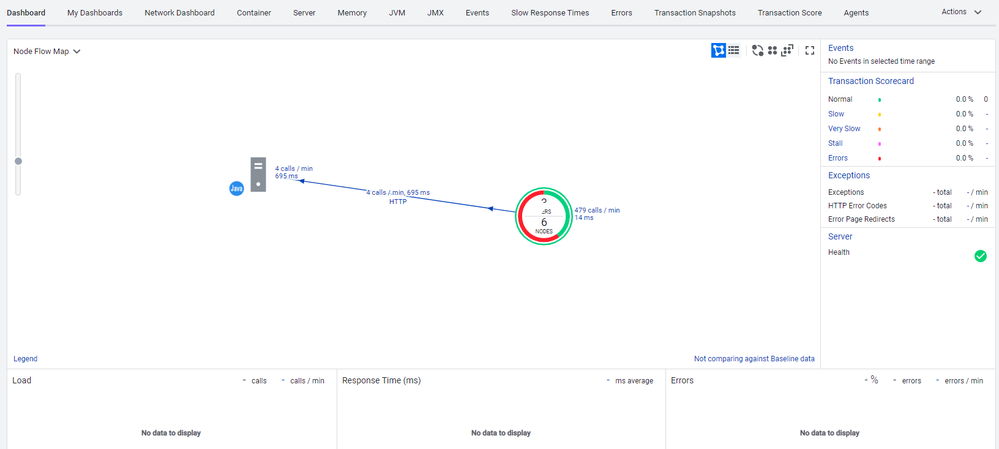
I am looking at the attached node flow map. I am not sure why the node is grey. I am assuming no data? but both the node and the line to it show metrics. So how come the node is grey and calls per min/ response time show no data? If anyone knows please let me know
Thanks
Solved! Go to Solution.
- Mark as New
- Bookmark
- Subscribe
- Mute
- Subscribe to RSS Feed
- Permalink
- Report Inappropriate Content
11-09-2022 09:59 AM
Hi @Nabil.Karroumi,
I found this AppD Docs page. Want to see if it helps answer your question? https://docs.appdynamics.com/appd/22.x/latest/en/application-monitoring/business-applications/flow-m...
Thanks,
Ryan, Cisco AppDynamics Community Manager
Found something helpful? Click the Accept as Solution button to help others find answers faster.
Liked something? Click the Thumbs Up button.
Check out Observabiity in Action
new deep dive videos weekly in the Knowledge Base.
- Mark as New
- Bookmark
- Subscribe
- Mute
- Subscribe to RSS Feed
- Permalink
- Report Inappropriate Content
11-14-2022 10:36 AM
Hi Ryan,
Thanks for the link. I saw that documentation but I still dont know why it would say no data and show grey node, but there are metrics associated with the node as well as the connection.
- Mark as New
- Bookmark
- Subscribe
- Mute
- Subscribe to RSS Feed
- Permalink
- Report Inappropriate Content
11-15-2022 09:34 AM - edited 11-16-2022 08:44 AM
Hi Nabil,
I did some more searching and a grey node, indicates typically it's not receiving data, but as your screenshot shows, it is, because you see calls.
You may want to submit a support ticket to see what's going on
If you do submit a ticket, please share the learnings/outcomes as a reply to this post.
Thanks,
Ryan, Cisco AppDynamics Community Manager
Found something helpful? Click the Accept as Solution button to help others find answers faster.
Liked something? Click the Thumbs Up button.
Check out Observabiity in Action
new deep dive videos weekly in the Knowledge Base.
Learn how Splunk and AppDynamics are redefining observability
Register Now!
Dive into our Community Blog for the Latest Insights and Updates!
Read the blog here
- AppD agent header singularityheader caused the message flow in IBM Integration Bus v10 failing to parse XML message body in Dynamic Languages (Node.JS, Python, PHP, C/C++, Webserver Agent)
- Get Application Flow data in Dashboards
- Node.JS business Transaction in Dynamic Languages (Node.JS, Python, PHP, C/C++, Webserver Agent)
- How to see Flow map between node and database? in Dashboards

Thank you! Your submission has been received!
Thank you! Your submission has been received!
Oops! Something went wrong while submitting the form
