- Community Hub
- Forum Q&A
- Business iQ (Analytics)
- Controller (SaaS, On Premise)
- Dashboards
- Dynamic Languages (Node.JS, Python, PHP, C/C++, Webserver Agent)
- End User Monitoring (EUM)
- Infrastructure (Server, Network, Database)
- Java (Java Agent, Installation, JVM, and Controller Installation)
- Licensing (including Trial)
- .NET (Agent, Installation)
- Smart Agent
- General Discussions
- Resources
- Groups
- Idea Exchange
Not a customer? Click the 'Start a free trial' link to begin a 30-day SaaS trial of our product and to join our community.
Existing Cisco AppDynamics customers should click the 'Sign In' button to authenticate to access the community
- Cisco AppDynamics Community
- Forums Q&A
- Dashboards
- Re: Errors dashboard shows 4k errors but not able ...
- Subscribe to RSS Feed
- Mark Topic as New
- Mark Topic as Read
- Float this Topic for Current User
- Bookmark
- Subscribe
- Mute
- Printer Friendly Page
- Mark as New
- Bookmark
- Subscribe
- Mute
- Subscribe to RSS Feed
- Permalink
- Report Inappropriate Content
08-03-2020 11:35 AM
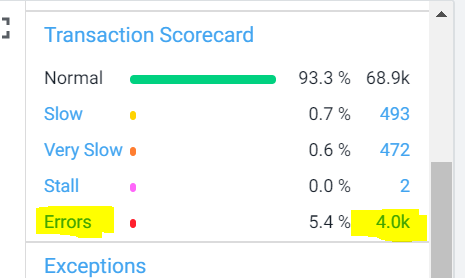
Errors dashboard shows 4k errors but not able to find the details for them
the snapshots that i have under errors is only 1k.
Solved! Go to Solution.
- Mark as New
- Bookmark
- Subscribe
- Mute
- Subscribe to RSS Feed
- Permalink
- Report Inappropriate Content
08-04-2020 07:32 AM
As mentioned earlier I am looking for the highlighted data.
When i click 4K it takes me to the metric browser.
I am trying to understand where i can find the 4K error details.
- Mark as New
- Bookmark
- Subscribe
- Mute
- Subscribe to RSS Feed
- Permalink
- Report Inappropriate Content
08-05-2020 10:27 AM - last edited on 09-09-2020 08:52 AM by Ryan.Paredez
Hi
You need to click on "Errors" not the count
That will open the errors window
You can also directly click on "Transaction snapshots" and just filter for Errors
Ciao
- Mark as New
- Bookmark
- Subscribe
- Mute
- Subscribe to RSS Feed
- Permalink
- Report Inappropriate Content
08-05-2020 10:31 AM - last edited on 10-21-2020 03:13 PM by Ryan.Paredez
thank you...I did do that. Now I see only 1k snapshots, so would the 4K errors be part of those 1k snapshots and I would need to drill into each one of them to locate the error details.
- Mark as New
- Bookmark
- Subscribe
- Mute
- Subscribe to RSS Feed
- Permalink
- Report Inappropriate Content
08-05-2020 10:54 AM
Hi
This can happen due to a variety of reasons
Out of the Box, AppDynamics will have limits set to ensure it does not do excessive snapshots, as this adds overhead to the application.
Most of the time you will not have a 1 to 1 ratio between Errors and snapshots, especially when the error rate is very high.
You will have to check what limits you have set, under Slow/Error Thresholds for the application, and there are options to increase the snapshot collection to be more aggressive, however it will add additional overhead to the system.
You need to finely balance the overhead AppDynamics puts on the application to how many snapshots it collects when errors occur or slow transactions happen.
In summary AppDynamics will monitor and report on every error, but not take a snapshot for every error(on low error rates it will mostly take a snapshot for every error).
You can then use the Exceptions & Error screens to zone in on the errors being seen.
You can also use the Dashboarding side to report on types of errors etc.
Hope this clears things up
- Mark as New
- Bookmark
- Subscribe
- Mute
- Subscribe to RSS Feed
- Permalink
- Report Inappropriate Content
08-05-2020 10:57 AM
Thanks Ciao.
- Mark as New
- Bookmark
- Subscribe
- Mute
- Subscribe to RSS Feed
- Permalink
- Report Inappropriate Content
08-05-2020 11:00 AM
Also just to double confirm in your reference to system you referring to the application right or the controller ?
- Mark as New
- Bookmark
- Subscribe
- Mute
- Subscribe to RSS Feed
- Permalink
- Report Inappropriate Content
08-05-2020 11:13 AM
Join us on Feb 26 to explore Splunk AppDynamics deployment strategies, SaaS models, agent rollout plans, and expert best practices.
Register Now
Dive into our Community Blog for the Latest Insights and Updates!
Read the blog here
- Agents not being managed by active smart agent in Smart Agent
- MRUM Session Replay Preview - Now Live! in End User Monitoring (EUM)
- Error detection/suppression in APM in General Discussions
- To monitor Java-based microservices running in Docker with AppDynamics in Java (Java Agent, Installation, JVM, and Controller Installation)
- Failed to resolve DB topological structure. java.sql.SQLException: ORA-01005: null password given; logon denied in Java (Java Agent, Installation, JVM, and Controller Installation)

Thank you! Your submission has been received!
Thank you! Your submission has been received!
Oops! Something went wrong while submitting the form
