Share a tip
cancel
Showing results for 
Show  only  | Search instead for 
Did you mean: 

Forum Posts

Share your favorite AppDynamics tips!

Welcome to our new tip collection—a place to exchange peer-to-peer advice. Sometimes a small adjustment, a pivot, or slight revision can make a tremendous difference. We hope this area grows into a rich resource with this kind of useful information. ...
Share a tip_sign in.png

Create deployments events within AppDynamics

Create deployment events within AppDynamics to allow you to review behavior changes over time. It’s not always obvious when performance changes.  Being able to work through it backwards via data to a specific release, where you can subsequently use V...

Green isn't always good

Before instrumenting an application with AppDynamics and reviewing the flow map, be sure you know what your performance metrics should be for the business transactions you are monitoring. AppDynamics will track each transaction and learn what normal ...

Joe.Byrne by AppDynamics Team
  • 1395 Views
  • 0 replies
  • 3 kudos

View the Standard Deviation of any metric

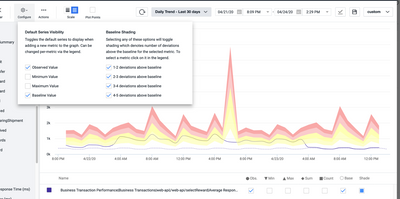
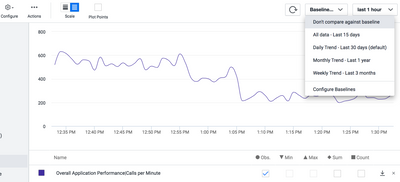
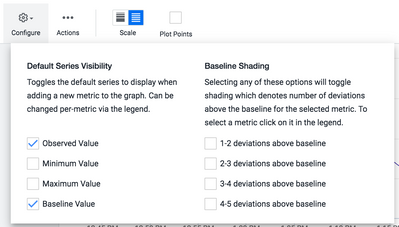
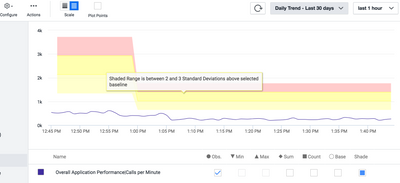
To view the Standard Deviation that AppDynamics has calculated for any metric, all you need to do is: 1. Open the metric you are interested in within the Metric Browser and, from the top right menu, select a Baseline to view:  2. Once selected, a new...

Screen Shot 2021-02-19 at 13.44.14.png Screen Shot 2021-02-19 at 13.49.28.png Screen Shot 2021-02-19 at 13.54.27.png

Quick Right-Click to monitor suspicious bites of code

When investigating application issues, often-times certain parts of a Snapshot's Call Graph can look a little suspicious.  "Does that class always time that long?""Is that Async Activity happening at the same time we're seeing messaging loads increas...

Fantastic Dashboards

Here are 21 beautiful dashboards for executive, operation, and development audiences. After extracting the zip file, go to Dashboards & Reports in your Controller and Import a JSON file. Ignore the Import warnings and map the dashboard widgets to you...

Database agent logs via UI

Its possible now to get database agent logs and thread dumps via the controller UI rather than having to ssh to the server where the db agent is located in. Helps reduce effort needed to manually download and share logs back to AppDynamics.        ...

Screen Shot 2021-02-18 at 18.58.15.png Screen Shot 2021-02-18 at 18.57.46.png

Select Multiple Business Transactions

When looking for common cause of slowness in a Business Transaction, sort the snapshots by execution time, click on one, hold down shift, then click on another 10 down.  You can now right-click and select "Identify the Most Expensive..."  You can the...

Multi-Select.png
Rob.Hewitt by AppDynamics Team
  • 1503 Views
  • 0 replies
  • 1 kudos

Laser Focus on Specific Time Ranges

When you notice spikes in Errors, Response Time, Load, etc on time series graphs - you can drag over the specific spike and focus only on transactions that occurred during that time. Additionally, Custom Time ranges are a great tool to utilize - they...

08_51_04.jpg 08_51_17.jpg 08_51_39.jpg
Top Kudoed Authors