- Community Hub
- Forum Q&A
- Business iQ (Analytics)
- Controller (SaaS, On Premise)
- Dashboards
- Dynamic Languages (Node.JS, Python, PHP, C/C++, Webserver Agent)
- End User Monitoring (EUM)
- Infrastructure (Server, Network, Database)
- Java (Java Agent, Installation, JVM, and Controller Installation)
- Licensing (including Trial)
- .NET (Agent, Installation)
- Smart Agent
- General Discussions
- Resources
- Groups
- Idea Exchange
Not a customer? Click the 'Start a free trial' link to begin a 30-day SaaS trial of our product and to join our community.
Existing Cisco AppDynamics customers should click the 'Sign In' button to authenticate to access the community
- Cisco AppDynamics Community
- Resources
- Knowledge Base
- How do I use the Extensions WorkBench?
- Subscribe to RSS Feed
- Mark as New
- Mark as Read
- Bookmark
- Subscribe
- Printer Friendly Page
- Report Inappropriate Content
At 6pm PST, the AppDynamics Community will go into read-only mode and after migration is complete, you will be redirected to community.splunk.com.
Read more here
- Article History
- Subscribe to RSS Feed
- Mark as New
- Mark as Read
- Bookmark
- Subscribe
- Printer Friendly Page
- Report Inappropriate Content
on
07-08-2020
03:42 PM
- edited on
10-19-2021
08:16 PM
by
Claudia.Landiva
Workbench is an inbuilt feature provided with each extension to help you to fine-tune the extension setup before you actually deploy it on the Controller. Workbench functionality is inbuilt with each extension JAR file.
Currently, the AppDynamics Platform does not allow a user to delete a metric once it has been registered. As soon as you deploy an extension directly after downloading, it will have several default settings.
If you wanted to make a minor change, say in the metricPrefix of the extension, after you deployed it with the default configuration, the platform would not allow you to delete the metrics with the default metricPrefix and you would have to keep the old metrics as well.
This useful feature should be used during the process of deploying each extension, since it will give you a better idea of what metrics will be recorded. If you see that you are missing some metrics, this tool will give you an opportunity to add those metrics as well.
In order to use Extensions Workbench, follow these steps:
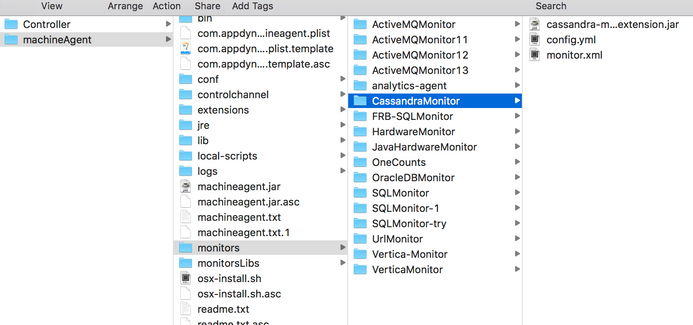
- Following the instructions on Cisco DevNet, build the specific extension's ZIP file and place it in the
monitorsfolder. - In the terminal, navigate to the extension folder.
- Verify that you have the main extension JAR file.
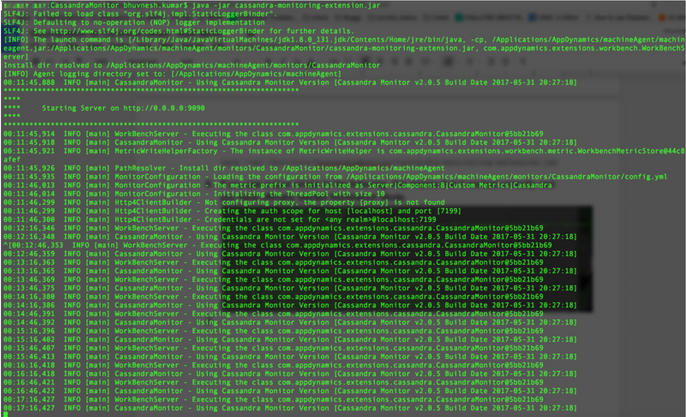
- Navigate to the extension folder that contains the jar file and execute the following command to start Workbench mode:
java -jar cassandra-monitoring-extension.jar
NOTE | Workbench by default uses port 9090. If you would like to change that to another port, use the following structure to build your command:java -jar <extension-jar> <host> <port> - If you see the following output in the terminal, this means that it worked correctly and you have officially started Workbench Mode.
- Now, open your browser and navigate to
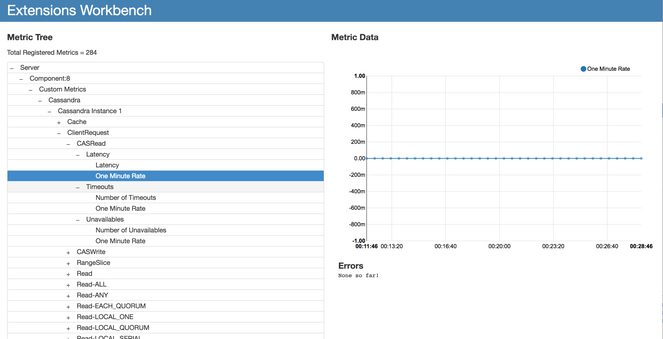
http://localhost:9090/. This starts the HTTP server that allows you to access the Workbench Mode. - Verify that all the desired metrics are present. Remove any unwanted metrics from the
config.ymlfile to reduce noise. - As you explore the map of metrics, you can see if you are getting a valid output on the graph on right. The metrics that are listed in the
config.ymlare the ones that are shown on the Workbench. - Once you are satisfied with the metrics and their values that are received, stop the current process and start the Machine Agent to view the metrics being reported on the metric browser.
- Mark as Read
- Mark as New
- Bookmark
- Permalink
- Report Inappropriate Content
where is the zip file? I really want to use this extension.
- Mark as Read
- Mark as New
- Bookmark
- Permalink
- Report Inappropriate Content
You can find all our extensions at https://www.appdynamics.com/community/exchange/
You can download the extension you would like and then configure it accordingly.
Thanks,
Bhuvnesh
- Mark as Read
- Mark as New
- Bookmark
- Permalink
- Report Inappropriate Content
- Mark as Read
- Mark as New
- Bookmark
- Permalink
- Report Inappropriate Content
Hi Adam,
If the extension was built by the AppDynamics Extensions team and if the documentation states that the extension (custom monitor) supports Workbench, then yes, it will work.
Thanks,
Bhuvnesh
- Mark as Read
- Mark as New
- Bookmark
- Permalink
- Report Inappropriate Content
It wasn't clear to me initially that the Cassandra extension is show here as one example only. This method can be generalized to ANY extension .... with the command of the form ... java -jar <some_extension_name_jar>
- Mark as Read
- Mark as New
- Bookmark
- Permalink
- Report Inappropriate Content
@Walter.Snyder, thank you for this point of clarification! I'm sure it will help others in the Community.
Claudia Landivar
Community Manager & Editor
- Mark as Read
- Mark as New
- Bookmark
- Permalink
- Report Inappropriate Content
It looks like doesn't work with Zookeepers extension.
- Mark as Read
- Mark as New
- Bookmark
- Permalink
- Report Inappropriate Content
Hello @Pablo.Jaña ,
Zookeeper extension should support workbench. Please create a Zendesk ticket with the error details if you are facing any issues with this.
You can find out more about creating a Support ticket here: https://community.appdynamics.com/t5/Knowledge-Base/How-do-I-submit-a-Support-ticket-An-FAQ/ta-p/289...
Thanks,
Satish Muddam
Join us on Feb 26 to explore Splunk AppDynamics deployment strategies, SaaS models, agent rollout plans, and expert best practices.
Register Now
Dive into our Community Blog for the Latest Insights and Updates!
Read the blog here

Thank you! Your submission has been received!
Thank you! Your submission has been received!
Oops! Something went wrong while submitting the form


