- Community Hub
- Forum Q&A
- Business iQ (Analytics)
- Controller (SaaS, On Premise)
- Dashboards
- Dynamic Languages (Node.JS, Python, PHP, C/C++, Webserver Agent)
- End User Monitoring (EUM)
- Infrastructure (Server, Network, Database)
- Java (Java Agent, Installation, JVM, and Controller Installation)
- Licensing (including Trial)
- .NET (Agent, Installation)
- Smart Agent
- General Discussions
- Resources
- Groups
- Idea Exchange
Not a customer? Click the 'Start a free trial' link to begin a 30-day SaaS trial of our product and to join our community.
Existing Cisco AppDynamics customers should click the 'Sign In' button to authenticate to access the community
- Cisco AppDynamics Community
- Resources
- Knowledge Base
- How do I increase custom metric limits for databas...
- Subscribe to RSS Feed
- Mark as New
- Mark as Read
- Bookmark
- Subscribe
- Printer Friendly Page
- Report Inappropriate Content
- Article History
- Subscribe to RSS Feed
- Mark as New
- Mark as Read
- Bookmark
- Subscribe
- Printer Friendly Page
- Report Inappropriate Content
on
11-07-2017
09:25 AM
- edited on
09-16-2022
01:49 PM
by
Claudia.Landiva
How do I resolve a Controller error message for exceeded custom metric limits for DB monitoring?
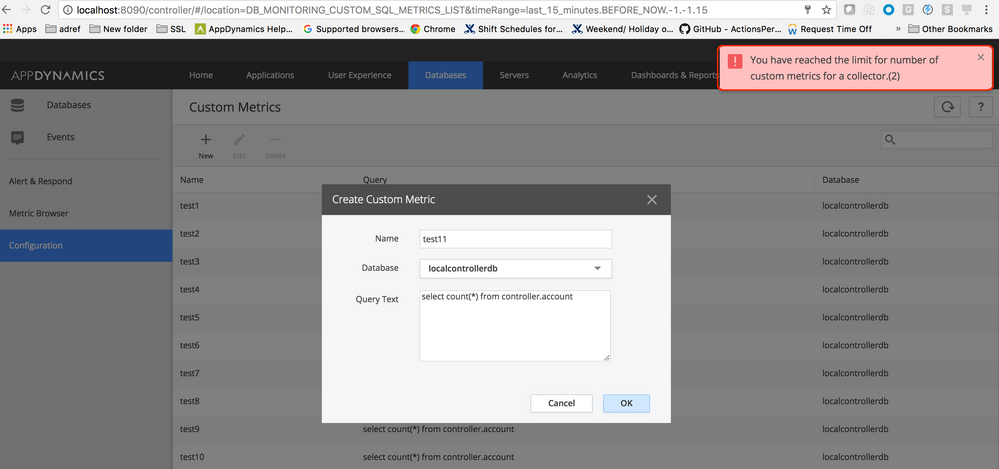
Users unable to add new custom metrics using the database monitoring tool may see the following error displayed in the Controller UI:

This issue occurs when the default limit for database monitoring has been reached.
By default, database monitoring supports up to 20 custom metrics per database. When this limit is reached, the tool will not create any new custom metrics and the above error is displayed.
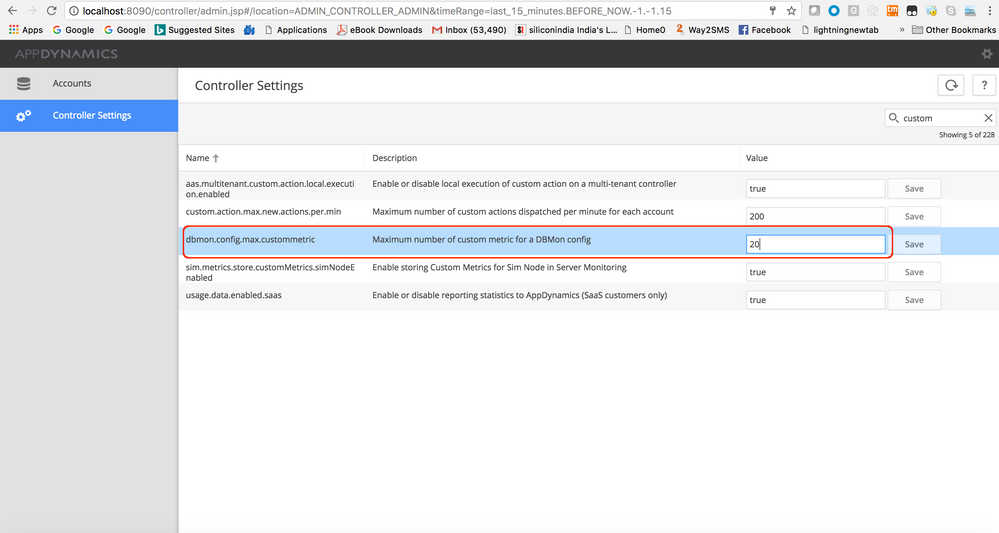
To resolve this issue, the user can configure the following property to a higher value.
- Within the Controller UI, using root login, access the
admin.jsppage and change the following property value:dbmon.config.max.custommetric - Click Save
Example

- Mark as Read
- Mark as New
- Bookmark
- Permalink
- Report Inappropriate Content
Thanks for share the link, But i already used this steps but still showing the alerts.
Learn how Splunk and AppDynamics are redefining observability
Watch Now!
Dive into our Community Blog for the Latest Insights and Updates!
Read the blog here

Thank you! Your submission has been received!
Thank you! Your submission has been received!
Oops! Something went wrong while submitting the form