- Community Hub
- Forum Q&A
- Business iQ (Analytics)
- Controller (SaaS, On Premise)
- Dashboards
- Dynamic Languages (Node.JS, Python, PHP, C/C++, Webserver Agent)
- End User Monitoring (EUM)
- Infrastructure (Server, Network, Database)
- Java (Java Agent, Installation, JVM, and Controller Installation)
- Licensing (including Trial)
- .NET (Agent, Installation)
- Smart Agent
- General Discussions
- Resources
- Groups
- Idea Exchange
Not a customer? Click the 'Start a free trial' link to begin a 30-day SaaS trial of our product and to join our community.
Existing Cisco AppDynamics customers should click the 'Sign In' button to authenticate to access the community
- Cisco AppDynamics Community
- Resources
- Knowledge Base
- How do I enable debug logging for an on-premises E...
- Subscribe to RSS Feed
- Mark as New
- Mark as Read
- Bookmark
- Subscribe
- Printer Friendly Page
- Report Inappropriate Content
At 6pm PST, the AppDynamics Community will go into read-only mode and after migration is complete, you will be redirected to community.splunk.com.
Read more here
- Article History
- Subscribe to RSS Feed
- Mark as New
- Mark as Read
- Bookmark
- Subscribe
- Printer Friendly Page
- Report Inappropriate Content
on
11-18-2020
01:55 PM
- edited on
11-18-2020
01:57 PM
by
Claudia.Landiva
What are the steps to enabling debug logging for an on-premises EUM Server?
What are the steps for an EUM Processor?
- In your computer terminal, navigate to
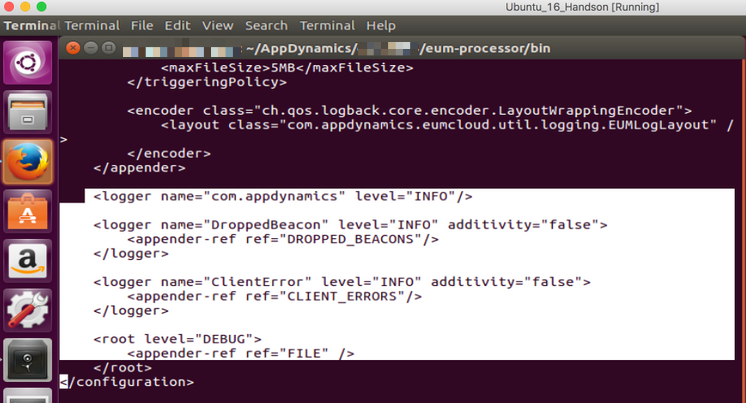
<EUM_HOME>/eum-processor/binand locate thelogback.xmlfile. - Open the file and change the logging level from INFO to DEBUG for the logger that you are interested in troubleshooting.
Example: - Save and restart the EUM Server.
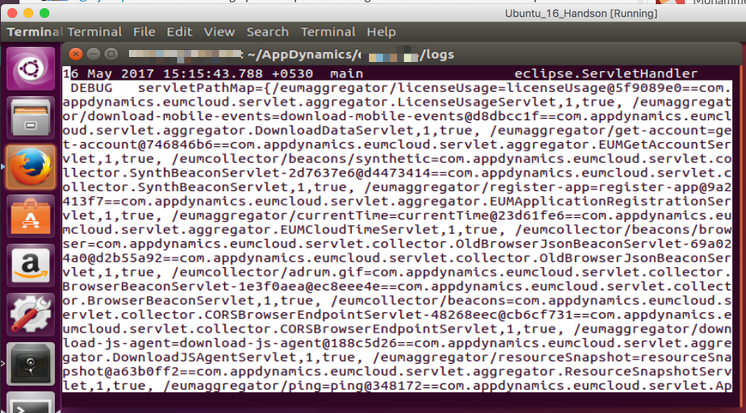
Example of typical debug logging
- Mark as Read
- Mark as New
- Bookmark
- Permalink
- Report Inappropriate Content
Hi....in the event that you get a "ping" reaction in the program window or"200 HTTP status code OK" utilizing twist, it implies you can interface with your EUM Server effectively and its not hung and if there's no reaction or program continues turning and in the long run the association gets reset,then it shows that the eum worker measure isn't reacting to your solicitation and thus we have to catch not many arrangement of string dumps( 3 to 5) with a recurrence of 30 secs to 60 secs apart,so that we can later look at the progressive string dumps and check if any strings of the eum worker measure was hung.
In the event that your On-Prem EUM Server Processor is running on windows,then underneath are the accessible alternatives to catch string dumps.
- Mark as Read
- Mark as New
- Bookmark
- Permalink
- Report Inappropriate Content
@Fin.Perlak, great addition to the topic!
Join us on Feb 26 to explore Splunk AppDynamics deployment strategies, SaaS models, agent rollout plans, and expert best practices.
Register Now
Dive into our Community Blog for the Latest Insights and Updates!
Read the blog here

Thank you! Your submission has been received!
Thank you! Your submission has been received!
Oops! Something went wrong while submitting the form

