- Community Hub
- Forum Q&A
- Business iQ (Analytics)
- Controller (SaaS, On Premise)
- Dashboards
- Dynamic Languages (Node.JS, Python, PHP, C/C++, Webserver Agent)
- End User Monitoring (EUM)
- Infrastructure (Server, Network, Database)
- Java (Java Agent, Installation, JVM, and Controller Installation)
- Licensing (including Trial)
- .NET (Agent, Installation)
- Smart Agent
- General Discussions
- Resources
- Groups
- Idea Exchange
Not a customer? Click the 'Start a free trial' link to begin a 30-day SaaS trial of our product and to join our community.
Existing Cisco AppDynamics customers should click the 'Sign In' button to authenticate to access the community
- Cisco AppDynamics Community
- Resources
- Knowledge Base
- How do I upload pre-built extension dashboards aut...
- Subscribe to RSS Feed
- Mark as New
- Mark as Read
- Bookmark
- Subscribe
- Printer Friendly Page
- Report Inappropriate Content
At 6pm PST, the AppDynamics Community will go into read-only mode and after migration is complete, you will be redirected to community.splunk.com.
Read more here
- Article History
- Subscribe to RSS Feed
- Mark as New
- Mark as Read
- Bookmark
- Subscribe
- Printer Friendly Page
- Report Inappropriate Content
on
01-08-2019
03:47 PM
- edited on
10-19-2021
02:52 PM
by
Claudia.Landiva
Uploading pre-built extension dashboards automatically: when and how do I do it?
Contents
- When can pre-built extension dashboards be automatically uploaded?
- How do I configure the extension with the necessary Controller information?
- Configuring the "controllerInfo" section
- Configuring the "customDashboard" section
- What post-configuration steps and considerations are there?
What is the use case for automatically uploading dashboard extensions?
AppDynamics extensions support automatically uploading a pre-built dashboard with every extension. This feature will help customers use an extension to extract all the listed metrics and provide an overview of how the product is doing in terms of certain key metrics. These dashboards can all be updated, and more data can be added to increase the visibility of the metrics the extension provides.
How do I configure the extension with the necessary Controller information?
In order to upload a dashboard to the Controller, you need to provide some information about the Controller that will help the extension log in and upload the dashboard to the Controller.
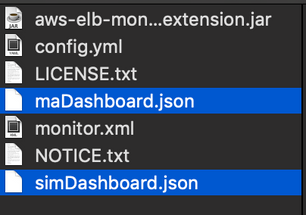
Each new extension is going to be equipped with two dashboard files: one for the Standalone Machine Agent model and one for the Server and Infrastructure Monitoring (SIM) model. While configuring the extension, you will need to configure the following sections: controllerInfo and customDashboard.
Configuring the "controllerInfo" section
This section requires you to fill out the information about the Controller, which in turn is used to make sure that the extension can establish a connection to the Controller and upload the dashboard.
The extension pulls the information in the following order from the following resources:
- controller-info.xml
- System Properties
- Config.yml
Update the following section in the config.yml:
controllerInfo:
    controllerHost: ""
    controllerPort: ""
    account: ""
    username: ""
    password: ""
    encryptedPassword: ""
    encryptionKey: ""
    controllerSslEnabled: ""
    enableOrchestration: ""
    uniqueHostId: ""
    accountAccessKey: ""
    machinePath: ""
    simEnabled: ""
    applicationName: ""
    tierName: ""
    nodeName: ""
As you start your agent, a number of the fields will be auto-populated. But a few fields will need to be manually populated. These are:
   username: ""
   password: ""
These fields are required for the Machine Agent to be able to log in and upload the dashboard. Once all this information is provided, populated, and validated, the extension will upload the dashboard to the Controller.
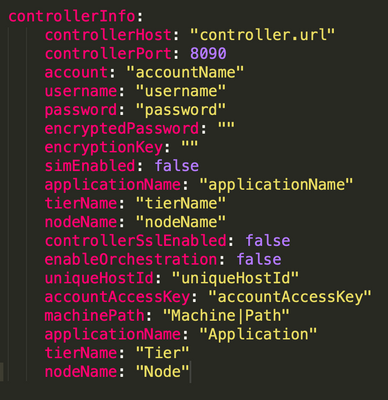
After filling it out, this section should look like this:
Configuring the "customDashboard" section
Similar to ControllerInfo, another section called customDashboard needs to be updated in order to make sure that a dashboard can be uploaded to the Controller from the extension.
customDashboard:
   enabled: true
   dashboardName: "Custom Dashboard"
   pathToSIMDashboard: "monitors/<ExtensionName>/simDashboard.json"
   pathToNormalDashboard: "monitors/<ExtensionName>/maDashboard.json"
   periodicDashboardCheckInSeconds: 300
- If enabled is false, the dashboard will not upload.
- If dashboardName is not present, the extension Monitor Name will be used as the dashboard name.
- The two fields that you should verify are the pathToSIMDashboard and pathToNormalDashboard. Both of these fields need to point to two files that are provided with the extension. If there are any changes made to these files, you must make sure that the changes are saved to these files, and in the case they are replaced with new files, their path should be updated in the
config.yml. - As the extension sits in the Machine Agent, the path after the base directory of the Machine Agent is needed.
- Make sure you have the correct file separator:
- (\) for Windows OS
- (/) for Linux-based OS
- Dashboards cannot be overwritten on the Controller. Therefore, if a dashboard is already present on the Controller, you will not be able to upload another dashboard with the same name.
- If you make any changes to the dashboard file to suit your needs, you should save the
dashboard.jsonfile and delete the current dashboard on the Controller. - By default, the extension will check to see whether a dashboard is present on the Controller every 5 minutes (300 seconds). If it is not present, it will attempt to upload it.
You have the option to increase or decrease this limit using the periodicDashboardCheckInSeconds parameter.
What post-configuration steps and considerations are there?
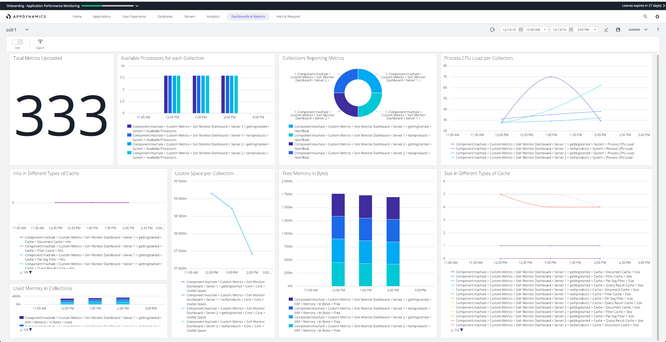
After filling in both these sections and configuring the rest of the extension to its specific needs, you can start the Machine Agent to gather metrics, and check to confirm that the dashboard has been uploaded and is being populated with the correct data.
What if I need to make changes to the dashboard file?
Every extension that comes with a dashboard has preconfigured metrics set to show in the dashboard. If any changes are made to the dashboard file, you will need to delete the existing dashboard present on the Controller so that the extension can upload a new copy of the dashboard with those changes.
How do I compare differences in versions of the dashboard file?
If you would like to compare the differences after making changes to the dashboard file, bear in mind that dashboard file names on the Controller must be unique. So, you should:
- Make sure your intended new dashboard name isn't already present on the Controller
- Change name of the dashboard in
config.ymlunder the customDashboard section
Once the extension hits the periodic dashboard check limit, it will again check if the dashboard with the new name is present. If not, it will upload the new dashboard which you may then use for comparison.
How do I add metrics to the dashboard file?
Each extension has specific metrics you can choose to display on the dashboard. If you would like to see other metrics, you can add them to the same dashboard (on the Controller) manually.
If any changes are made to the metric names/aliases in the config.yml, those changes need to be replicated in the dashboard.json files since they are preconfigured to look for metrics with the default metric names/aliases that are provided with a new copy of the extension.
If changes to the metric names/aliases in the config.yml are not replicated, there is a good chance that the dashboard widgets associated with the corresponding metrics may not work.
Join us on Feb 26 to explore Splunk AppDynamics deployment strategies, SaaS models, agent rollout plans, and expert best practices.
Register Now
Dive into our Community Blog for the Latest Insights and Updates!
Read the blog here

Thank you! Your submission has been received!
Thank you! Your submission has been received!
Oops! Something went wrong while submitting the form


