- Community Hub
- Forum Q&A
- Business iQ (Analytics)
- Controller (SaaS, On Premise)
- Dashboards
- Dynamic Languages (Node.JS, Python, PHP, C/C++, Webserver Agent)
- End User Monitoring (EUM)
- Infrastructure (Server, Network, Database)
- Java (Java Agent, Installation, JVM, and Controller Installation)
- Licensing (including Trial)
- .NET (Agent, Installation)
- Smart Agent
- General Discussions
- Resources
- Groups
- Idea Exchange
Not a customer? Click the 'Start a free trial' link to begin a 30-day SaaS trial of our product and to join our community.
Existing Cisco AppDynamics customers should click the 'Sign In' button to authenticate to access the community
- Cisco AppDynamics Community
- Resources
- Knowledge Base
- How do I retrieve metrics and so I can display the...
- Subscribe to RSS Feed
- Mark as New
- Mark as Read
- Bookmark
- Subscribe
- Printer Friendly Page
- Report Inappropriate Content
- Article History
- Subscribe to RSS Feed
- Mark as New
- Mark as Read
- Bookmark
- Subscribe
- Printer Friendly Page
- Report Inappropriate Content
on 06-05-2020 10:02 AM - edited on 05-06-2024 03:28 PM by Ryan.Paredez
What method can I use to programmatically call AppDynamics’ Metrics and Snapshots API from Microsoft Power BI to retrieve time series/metrics data, and then display that data using MS Power BI?
Part 1 of 2
Overview
AppDynamics Metrics and Snapshots API can be easily called programmatically.
If you want to get Time Series/Metrics data from Microsoft Power BI, first consider whether you want to retrieve it directly via API, or indirectly through a batch process such as Entity Metrics Report in Power BI.
NOTE: Power BI is only available for Windows.
This article focuses on how to retrieve Time Series/Metrics data directly via API.
To learn how to take the next steps of visualizing and publishing this data in Power BI, see How do I display and publish metrics data with Microsoft Power BI? Part 2.
In this article...
Get REST API URL for Metrics
How do I build my credentials and query?
- Create Credentials:
You can create an internal AppDynamics account for basic authentication, or Create a Client API token as described in API Clients. - Install the Power BI Desktop client, either from this site https://powerbi.microsoft.com/ or from the Microsoft Store.
- Get REST URL for Metric Extraction:
In AppDynamics, open Metric Browser and find the metric you want.
For example, here we are retrieving "Overall Application Performance|Calls per Minute" metric for an Application.Metric Browser - E-Commerce: retrieving "Overall Application Performance|Calls per Minute" metric for an Application
As above, right-click on metrics and click copy the URL to REST API invocation.
The resulting URL will look something like this:http://yourcontrollerhost.maybeonsaas.com/controller/rest/applications/ECommerce/metric-data?metric-path=Overall%20Application%20Performance%7CCalls%20per%20Minute&time-range-type=BEFORE_NOW&duration-in-mins=60
- Modify the URL by appending "output=json" and "rollup=false" parameters like this:
http://yourcontrollerhost.maybeonsaas.com/controller/rest/applications/ECommerce/metric-data?metric-path=Overall%20Application%20Performance%7CCalls%20per%20Minute&time-range-type=BEFORE_NOW&duration-in-mins=60
The components in the Query String are as follows:
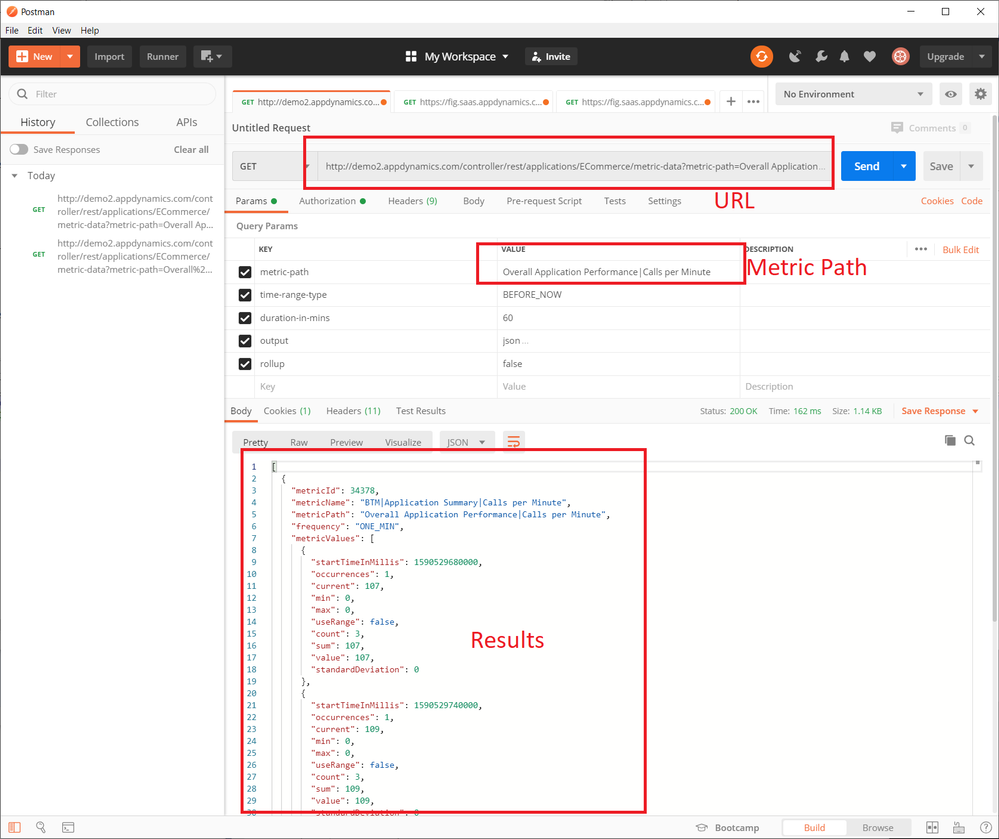
"metric-path=Overall Application Performance|Calls per Minute"
specifies metric path
"time-range-type=BEFORE_NOW"
specifies that the measuring is going from NOW back some time range. Other values can be "BETWEEN_TIMES"
"duration-in-mins=60"
specifies how many minutes to go back from BEFORE_NOW
"output=json"
specifies that the API should return data formatted as JSON object
"rollup=false"
specifies that all metric values should be returned
Test Your Query and Credentials
Use your favorite tool—such as cURL, Wget, PowerShell, or Postman—to test the query. Below, it’s being tested in Postman and clearly returns some nice data:
Transform the data into PowerBI Format
- Set up the Power BI Data Source
- Add parameters to the query
- Modify Data Source to Use Parameters
- Convert JSON to Tabular Data using Transformations
- Convert some columns to different data types
Set up the Power BI Data Source
- Open Power BI
- Create a new PBIX file
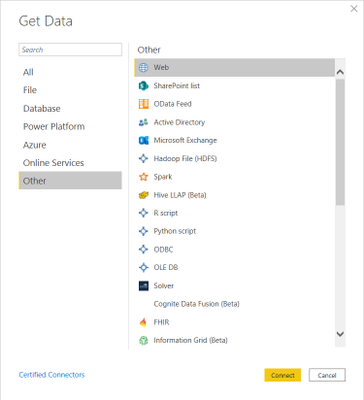
- Click Get Data
- Select Other\Web
- Click Connect
- Select the Basic option on the From Web dialog
- Paste the REST URL previously tested
- Click OK
Paste the REST URL into the Basic option on the From Web dialog
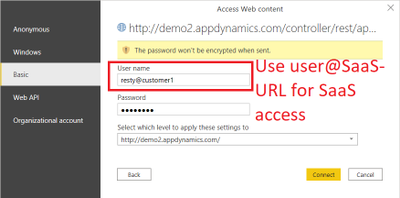
- If you’ve never authenticated to this data source before, you’ll be prompted for credentials, as follows:
Access Web Content data source authentication settings
- If using AppDynamics internal username/password, switch to the Basic tab.
- Specify "username@account" in the "User Name" textbox
- Specify your password in Password textbox
- If using Client API token, specify "BEARER" in the username, and value of the token in Password
- Click Connect
Your credentials will be saved in both this workbook and in the global credential cache for your OS.
- If using AppDynamics internal username/password, switch to the Basic tab.
Congratulations! You have data from AppDynamics as a JSON document. You can't do much with it yet, though. Next, you must massage it into something you can graph.
Add parameters to the query
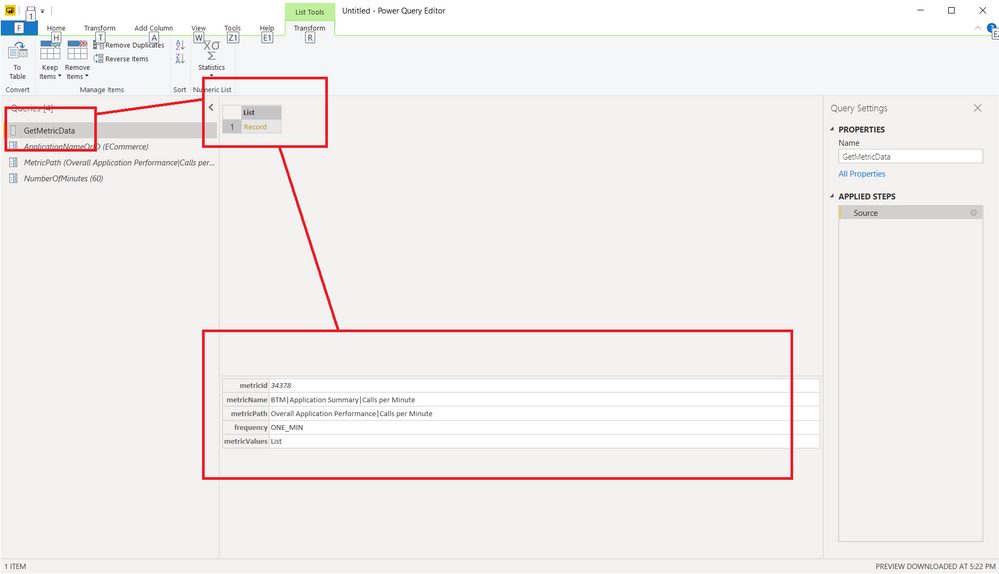
- Rename Query1 to GetMetricData in the list of Queries on the left
- Click the Home\Parameters\Manage Parameters button on the ribbon
- Create 3 new Parameters by clicking the New button at the top of the parameter list, then entering the following settings:
Name
Type
Value
ApplicationNameOrID
String
[Name or ID of your Application]
MetricPath
String
Overall Application Performance|Calls per Minute
NumberOfMinutes
String
60
Manage Parameters dialog: Application Name
Manage Parameters dialog: MetricPath
Manage Parameters dialog: Number of Minutes
You’ll be able to modify these parameters later.
Modify Data Source to Use Parameters
- Click the Home\Data Sources\Data source settings button on the ribbon
- Select your data source and click the Change Source button
- Click the Advanced radio button
Data Source Dialog > Advanced Settings > Constructing REST URL from parameters
- Using the buttons to the left of the URL Part, create the following flow:
Part Type
Value
Text
http[s]://<yourcontroller>/controller/rest/applications/
Parameter
ApplicationNameOrID
Text
/metric-data?metric-path=
Parameter
MetricPath
Text
&time-range-type=BEFORE_NOW&duration-in-mins=
Parameter
NumberOfMinutes
Text
&output=json&rollup=false
The screen should look like this:Parameters intermingled with text literals produce the REST API URLs that can accept parameters
The URL Preview text box shows the result of your configuration and it should look like this:http://yourcontrollerhost.maybeonsaas.com/controller/rest/applications/{ApplicationNameOrID}/metric-data?metric-path={MetricPath}&time-range-type=BEFORE_NOW&duration-in-mins={NumberOfMinutes}&output=json&rollup=false -
Click OK
-
Click Close
-
Click the Home\Query\Refresh Preview button on the ribbon
Convert JSON to Tabular Data using Transformations
- Click on GetMetricData query in the Queries list
- Select the first record in the list
- Click Transform\Convert\To Table button on the ribbon
- Confirm default transformation settings in To Table dialog
- Click OK
Convert JSON List to Table
- Select Column1 column in the query results window
- Click Transform\Structured Column\Expand on the ribbon
- Remove any text from the Default column name prefix text box
- Click OK
Expand Table to Columns
- Select the metricValues column in the query results window
- Click Transform\Structured Column\Expand in the ribbon
Expand Table to Columns again
- Select the metricValues column in the query results window again
- Click Transform\Structured Column\Expand in the ribbon
- Remove any text from the Default column name prefix text box
- Click OK
Convert some columns to different data types
- Select startTimeInMillis column in query results window
- Click Add Column\General\Custom Column button on the ribbon
- Specify EventTime in New column name text box
- Enter following formula in the Custom column formula text box:
=#datetime(1970, 1, 1, 0, 0, 0) + #duration(0, 0, 0, [startTimeInMillis]/1000) - Click OK
Create DataTime column out of Unix timestamp
- Select EventTime column in the query results window
- Click Transform\Any Column\Data Type drop-down and select Date/Time
Explicitly define DateTime column type
- Select value column in the query results window
- Click Transform\Any Column\Data Type drop-down and select Whole Number
Change data type of the value column to number
Repeat these steps for all other columns you have a need for, like "sum", "count", "min", "max" and "standardDeviation".
Resulting Dataset
You are done! The resulting dataset is a thing of beauty.
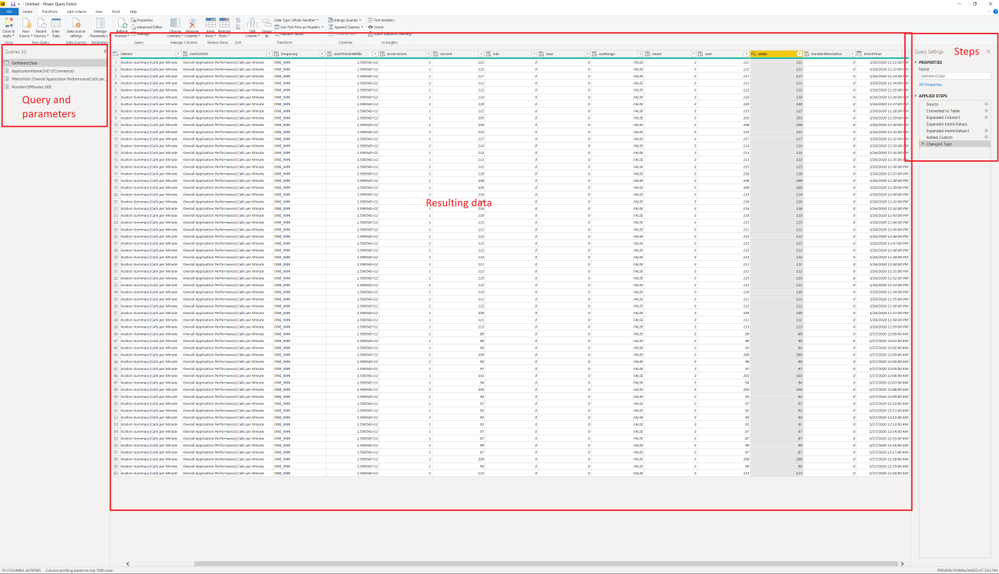
Final GetMetricData query in Power Query M
Your final query for GetMetricData in Power Query M language should look like this:
let

    Source = Json.Document(Web.Contents("http://demo2.appdynamics.com/controller/rest/applications/" & ApplicationNameOrID & "/metric-data?metric-path=" & MetricPath & "&time-range-type=BEFORE_NOW&duration-in-mins=" & NumberOfMinutes & "&output=json&rollup=false")),

    #"Converted to Table" = Table.FromList(Source, Splitter.SplitByNothing(), null, null, ExtraValues.Error),

    #"Expanded Column1" = Table.ExpandRecordColumn(#"Converted to Table", "Column1", {"metricId", "metricName", "metricPath", "frequency", "metricValues"}, {"metricId", "metricName", "metricPath", "frequency", "metricValues"}),

    #"Expanded metricValues" = Table.ExpandListColumn(#"Expanded Column1", "metricValues"),

    #"Expanded metricValues1" = Table.ExpandRecordColumn(#"Expanded metricValues", "metricValues", {"startTimeInMillis", "occurrences", "current", "min", "max", "useRange", "count", "sum", "value", "standardDeviation"}, {"startTimeInMillis", "occurrences", "current", "min", "max", "useRange", "count", "sum", "value", "standardDeviation"}),

    #"Added Custom" = Table.AddColumn(#"Expanded metricValues1", "EventTime", each #datetime(1970, 1, 1, 0, 0, 0) + #duration(0, 0, 0, [startTimeInMillis]/1000)),

    #"Changed Type" = Table.TransformColumnTypes(#"Added Custom",{{"EventTime", type datetime}, {"value", Int64.Type}})

in

    #"Changed Type"
- Click Home\Close\Close & Apply on the ribbon to save all the changes and apply the query
- Save the resulting PBIX file somewhere on your machine
Next Steps
To visualize and publish your data using Microsoft Power BI, you will need the PBIX file you saved in Step 11, above.
Go to How do I display and publish metrics data with Microsoft Power BI? - Part 2 for the step-by-step instructions.
Resources
To learn how to take the next steps of visualizing and publishing this data in Power BI, see How do I display and publish metrics data with Microsoft Power BI? Part 2.
- Mark as Read
- Mark as New
- Bookmark
- Permalink
- Report Inappropriate Content
Hi,
Is there a way to pull all metrics?
The reason is that I need to be able filter all metrics with "No data to display" for all the applications we have.
Regards,
Khalid
Join us on Feb 26 to explore Splunk AppDynamics deployment strategies, SaaS models, agent rollout plans, and expert best practices.
Register Now
Dive into our Community Blog for the Latest Insights and Updates!
Read the blog here

Thank you! Your submission has been received!
Thank you! Your submission has been received!
Oops! Something went wrong while submitting the form
