- Community Hub
- Forum Q&A
- Business iQ (Analytics)
- Controller (SaaS, On Premise)
- Dashboards
- Dynamic Languages (Node.JS, Python, PHP, C/C++, Webserver Agent)
- End User Monitoring (EUM)
- Infrastructure (Server, Network, Database)
- Java (Java Agent, Installation, JVM, and Controller Installation)
- Licensing (including Trial)
- .NET (Agent, Installation)
- Smart Agent
- General Discussions
- Resources
- Groups
- Idea Exchange
Not a customer? Click the 'Start a free trial' link to begin a 30-day SaaS trial of our product and to join our community.
Existing Cisco AppDynamics customers should click the 'Sign In' button to authenticate to access the community
- Cisco AppDynamics Community
- Forums Q&A
- General Discussions
- Re: Otel traces data not visible in AppDynamics
- Subscribe to RSS Feed
- Mark Topic as New
- Mark Topic as Read
- Float this Topic for Current User
- Bookmark
- Subscribe
- Mute
- Printer Friendly Page
Otel traces data not visible in AppDynamics
- Mark as New
- Bookmark
- Subscribe
- Mute
- Subscribe to RSS Feed
- Permalink
- Report Inappropriate Content
10-12-2023 01:33 AM - edited 10-12-2023 01:34 AM
Hi team,
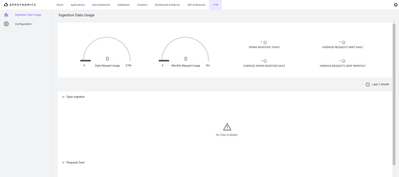
I have currently configured my Otel Collector to send traces data from the adservice (Otel-demo service) to AppDynamics over a proxy. My problem is that AppDynamics doesn't show any ingested data in the Otel section (No Data available). The collector logs show no errors.
This is my Collector config:
config: |
  receivers:
    otlp:
      protocols:
        grpc:
        http:

  processors:
      resource:
      attributes:
      - key: appdynamics.controller.account
        action: upsert
        value: "company"
      - key: appdynamics.controller.host
        action: upsert
        value: "company.saas.appdynamics.com"
      - key: appdynamics.controller.port
        action: upsert
        value: 443

    batch:
      send_batch_size: 90
      timeout: 30s

  exporters:
    otlphttp:
      endpoint: "https://some-agent-api.saas.appdynamics.com"
      headers: {"x-api-key": "<some-api-key>"}

     logging:
      verbosity: detailed
      sampling_initial: 10
      sampling_thereafter: 5

  extensions:
    zpages:
  service:
    telemetry:
      logs:
        level: debug
    extensions: [zpages]
    pipelines:
      traces:
        receivers: [otlp]
        processors: [resource, batch]
        exporters: [logging, otlphttp]

env:
- name: HTTPS_PROXY
  value: proxy.company.com:8080
- Mark as New
- Bookmark
- Subscribe
- Mute
- Subscribe to RSS Feed
- Permalink
- Report Inappropriate Content
10-12-2023 03:55 PM
Hi @Oliver.Ulfik,
One of your posts was flagged for spam, (the one with the larger code snippet). I've decided to leave this post here and archive the other.
If you have not yet seen them, here are some Otel Technical Knowledge Base articles we have around Otel.
If I find any more specific info, I'll be sure to share it. In the meantime, let's see if the Community can jump in and help out.
Thanks,
Ryan, Cisco AppDynamics Community Manager
Found something helpful? Click the Accept as Solution button to help others find answers faster.
Liked something? Click the Thumbs Up button.
Check out Observabiity in Action
new deep dive videos weekly in the Knowledge Base.
- Mark as New
- Bookmark
- Subscribe
- Mute
- Subscribe to RSS Feed
- Permalink
- Report Inappropriate Content
10-13-2023 05:44 AM
Hi @Ryan.Paredez ,
yes, seems like the collector log was too long. If someone wants to have a look, here is the link to my logfile: https://github.com/open-telemetry/opentelemetry-collector/files/12803473/collector-log.txt
Learn how Splunk and AppDynamics are redefining observability
Watch Now!
Dive into our Community Blog for the Latest Insights and Updates!
Read the blog here
- Need to programmatically gather mobile crash details in Controller (SaaS, On Premises)
- Azure API Management gateway monitoring in NET (Agent, Installation)
- Citrix VAD configuration in Java (Java Agent, Installation, JVM, and Controller Installation)
- .Net Application -> OpenTelemetry Collector -> AppDynamics in NET (Agent, Installation)

Thank you! Your submission has been received!
Thank you! Your submission has been received!
Oops! Something went wrong while submitting the form
