- Community Hub
- Forum Q&A
- Business iQ (Analytics)
- Controller (SaaS, On Premise)
- Dashboards
- Dynamic Languages (Node.JS, Python, PHP, C/C++, Webserver Agent)
- End User Monitoring (EUM)
- Infrastructure (Server, Network, Database)
- Java (Java Agent, Installation, JVM, and Controller Installation)
- Licensing (including Trial)
- .NET (Agent, Installation)
- Smart Agent
- General Discussions
- Resources
- Groups
- Idea Exchange
Not a customer? Click the 'Start a free trial' link to begin a 30-day SaaS trial of our product and to join our community.
Existing Cisco AppDynamics customers should click the 'Sign In' button to authenticate to access the community
- Cisco AppDynamics Community
- Forums Q&A
- Dashboards
- Re: The AppD Transaction Score as a Dashboard??
- Subscribe to RSS Feed
- Mark Topic as New
- Mark Topic as Read
- Float this Topic for Current User
- Bookmark
- Subscribe
- Mute
- Printer Friendly Page
- Mark as New
- Bookmark
- Subscribe
- Mute
- Subscribe to RSS Feed
- Permalink
- Report Inappropriate Content
10-04-2017 09:36 AM
Does anybody have a good example where they've replicated the Transaction Score within a given app to a dashboard that can be shared?
Solved! Go to Solution.
- Mark as New
- Bookmark
- Subscribe
- Mute
- Subscribe to RSS Feed
- Permalink
- Report Inappropriate Content
10-08-2017 10:15 PM
Hi Harlan,
I am afraid you cannot see transaction scorecard as it is in dashboard.
However, you can always create a dashboard using any metric from metric browser.
Thanks,
Atyuha
- Mark as New
- Bookmark
- Subscribe
- Mute
- Subscribe to RSS Feed
- Permalink
- Report Inappropriate Content
10-12-2017 04:08 AM
That is unfortunate. This seems like a very modular and valuable option that would provide not just the NOC teams (1st and 2nd level) quick Business Level views from a per app scenario but also a potential complete roll-up of all apps in the company to get that full "hows my business running" Ops view. Additional to that it would provide scenarios where specific LOB's and Business units a single view of their test applications, QA, production, etc.
- Mark as New
- Bookmark
- Subscribe
- Mute
- Subscribe to RSS Feed
- Permalink
- Report Inappropriate Content
10-12-2017 05:04 AM
Hi Harlan,
We have an enhancement request raised already to address this. This request is still in PM queue and hence we are not sure regarding the timeline of this.
Thanks,
Yogesh
- Mark as New
- Bookmark
- Subscribe
- Mute
- Subscribe to RSS Feed
- Permalink
- Report Inappropriate Content
07-31-2023 02:47 AM
Hi
has there been any update to this?
- Mark as New
- Bookmark
- Subscribe
- Mute
- Subscribe to RSS Feed
- Permalink
- Report Inappropriate Content
03-25-2024 11:30 PM
Hi, has there been any update since?
- Mark as New
- Bookmark
- Subscribe
- Mute
- Subscribe to RSS Feed
- Permalink
- Report Inappropriate Content
03-26-2024 01:44 AM
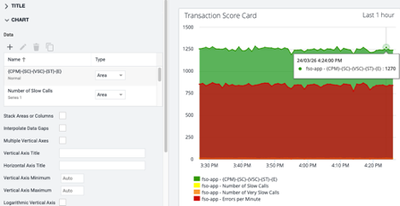
As mentioned by @Atyuha.Pal , we can make use of Metric Browser to create one. Here's a simple workaround:
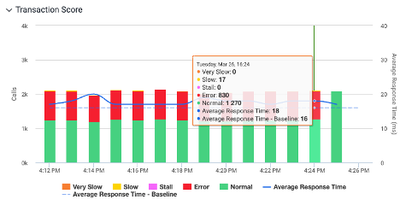
If you open the Transaction Score Card and double-click on any of the bar chart, it will take you to the Metric Browser where you can see the metrics used e.g. Number of Slow Call, Stall Count etc.
Using that, you can create a dashboard by inputing those metrics.
We have Slow, Vey Slow, Error, Stall. So, the tricky part is to create the "Normal". We can use the metric expression to derive Normal = Call per Min - Slow - Very Slow - Stall - Error
I did a quick check and the value looks correct.
thanks,
Terence
- Mark as New
- Bookmark
- Subscribe
- Mute
- Subscribe to RSS Feed
- Permalink
- Report Inappropriate Content
03-28-2024 08:30 AM
Hi @Jared.Botha,
Did the information from @Terence.Chen help?
Thanks,
Ryan, Cisco AppDynamics Community Manager
Found something helpful? Click the Accept as Solution button to help others find answers faster.
Liked something? Click the Thumbs Up button.
Check out Observabiity in Action
new deep dive videos weekly in the Knowledge Base.
Join us on Feb 26 to explore Splunk AppDynamics deployment strategies, SaaS models, agent rollout plans, and expert best practices.
Register Now
Dive into our Community Blog for the Latest Insights and Updates!
Read the blog here
- Unable to query the No.of calls of a business transaction in Controller (SaaS, On Premises)
- My problem with baselines and moving averages ingesting bad data in Controller (SaaS, On Premises)
- Custom Method Data Collectors to Custom Metrics in Business iQ (Analytics)
- Get a full URL of a slow Transaction Snapshot in NET (Agent, Installation)
- Anyway to show Baseline metrics with an Analytics search within a Dashboard table? in Business iQ (Analytics)

Thank you! Your submission has been received!
Thank you! Your submission has been received!
Oops! Something went wrong while submitting the form

