Using Data Collector in AppDynamics for .NET WCF service
Hi Team,We need your help in reviewing Data Collectors created in AppDynamics for .NET WCF service.We need your guidance as newly Data Collectors are not working. Thank you,Deepak Paste
Click the Start a free trial link to start a 30-day SaaS trial of our product and join our community as a trial customer. If you are an existing customer do not start a free trial.
AppDynamics customers and established members should click the sign in button to authenticate.
Hi Team,We need your help in reviewing Data Collectors created in AppDynamics for .NET WCF service.We need your guidance as newly Data Collectors are not working. Thank you,Deepak Paste
Dear team,Am using windows machine agent to capture default metrics ,but am getting the following error in client side when enabled the debug mode.com.google.inject.ProvisionException: Unable to provision, see the following errors: 1) [Guice/ErrorInC...
Hello All, Please let me know how to install the AppDynamics platform UI because I can see no product in the downloads folder. Not able to install appdynamics console i.e. platform file also the file is not available in the download portal Thanks, S...
How to create top 10 DB queries in AppD dashboards and reports.
Hello, we are working on setting some Health rules in AppDynamics to monitor slow-running queries in the Database. After going through the documentation on the website, we configured a health rule as seen below. Our problem with this is that there is...


Any idea on how to configure for total calls per 1 Hour's & total calls per 24 Hours App-D metrics. Please help me here.
I'm trying to set query on dashboard as metric, if data looks like below I'm expecting it to show aggregate count at 07:00 amI have already set query as metric, it fetches count of data from last one hour also schedule on Metrics is set to 1 hourOn "...
Hi everyone I have a problem with one process on a server that I can't graph, the process is in Java and I can see it on the machine: I need to create a dashboard to see the behavior and set up alarms for specific thresholds, but when I want to capt...
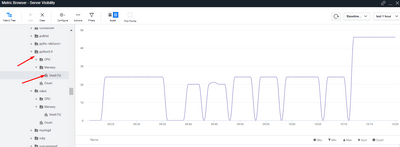
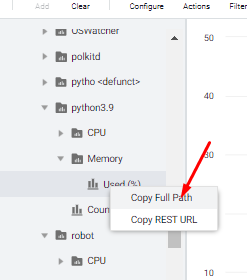

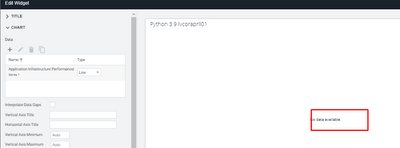
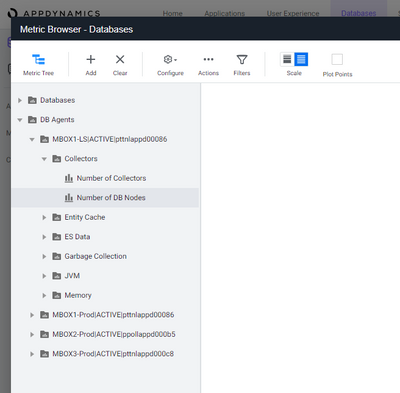
My team needs to create a dashboard that monitors the number of DB connections per DB agent, and I'm pretty sure that I've found the metric for this in the metric browser under the DB tab (number of DB nodes), but I'm unable to find it when I'm addin...
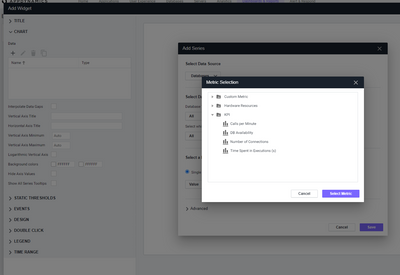
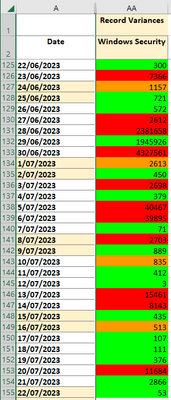
Hello Team,I presently have a single numeric value that is published to AppD every day, below is a sample of this extract:name=Custom Metrics|GRA|Pipeline View|WinSec|Total Input, value=7366, aggregator=AVERAGE, time-rollup=AVERAGE, cluster-rollup=IN...
| User | Count |
|---|---|
| 7 | |
| 2 | |
| 1 | |
| 1 | |
| 1 | |
| 1 |

Thank you! Your submission has been received!
Thank you! Your submission has been received!
Oops! Something went wrong while submitting the form