- Community Hub
- Forum Q&A
- Business iQ (Analytics)
- Controller (SaaS, On Premise)
- Dashboards
- Dynamic Languages (Node.JS, Python, PHP, C/C++, Webserver Agent)
- End User Monitoring (EUM)
- Infrastructure (Server, Network, Database)
- Java (Java Agent, Installation, JVM, and Controller Installation)
- Licensing (including Trial)
- .NET (Agent, Installation)
- Smart Agent
- General Discussions
- Resources
- Groups
- Idea Exchange
Not a customer? Click the 'Start a free trial' link to begin a 30-day SaaS trial of our product and to join our community.
Existing Cisco AppDynamics customers should click the 'Sign In' button to authenticate to access the community
- Cisco AppDynamics Community
- Resources
- Knowledge Base
- Using Business Metrics on Cisco Cloud Observabilit...
- Subscribe to RSS Feed
- Mark as New
- Mark as Read
- Bookmark
- Subscribe
- Printer Friendly Page
- Report Inappropriate Content
- Article History
- Subscribe to RSS Feed
- Mark as New
- Mark as Read
- Bookmark
- Subscribe
- Printer Friendly Page
- Report Inappropriate Content
on 11-30-2023 02:24 PM - edited on 05-07-2024 09:24 AM by Ryan.Paredez
When should I opt to use Business Metrics and how do I configure them?
Organizations commonly track KPIs like Total Revenue, Order Count, etc. to monitor the health of their business. These KPIs influence the organization's spending decisions and allow the analysis of the impact of their spending. It is also desirable to track these KPIs in near real-time rather than waiting for periodic reports.
Recently, Cisco AppDynamics released support for Business Metrics as part of the Cisco Cloud Observability Platform. This brings about a powerful capability for business owners to monitor application performance. It also enables users to slice business metric data into segments and set up health rules.
In this article…
- Why Business Metrics?
- How do Business Metrics work?
- Business Metrics best practices
- Additional resources
Why Business Metrics?
The obvious question that arises is: what is the need for the feature and why can’t Custom Metrics or Span Metrics do the job?
Custom Metrics are emitted from the application and are usually aggregated in a time series for presentation. The measurements are usually generated in the application with the help of an OpenTelemetry Metrics SDK and usually have dimensions attached. The measurements are aggregated in a time series fashion within an observability solution.
Span Metrics are emitted by a custom, which can be used to scrape span attributes to generate metric measurements with the required dimensions. This approach also allows you to emit metric measurements with the desired dimensions. It can potentially be used to build a custom collector that emits the measurements by processing the entire trace. However, it may require code changes and multiple iterations to get the desired functionality in place.
Custom Metrics or Span Metrics may serve your purpose very well if the metric of interest and the associated dimensions originate from a single span and you know which span to find it in. However, in modern distributed architectures in the cloud, an application consists of multiple microservices. A single business transaction can have spans across 10s or 100s of microservices. In such deployments, it is not easy to correlate different dimensions for the same metric across spans.
Business Metrics in Cisco Cloud Observability solves this problem by traversing business transaction spans and collecting the metric and all its dimensions as part of a single measurement. This can be extremely useful as users can now slice and dice metric data based on the dimensions to gain deep insights into the performance of their business.
Business Metrics also has an easy configuration experience with prescriptive templates for business owners to easily configure the metrics for their use cases. Another advantage of this approach is that the user also gets a visual data preview during the configuration, allowing them to select the attribute for generating measurements as well as the dimensions to segment the data.
How do Business Metrics work?
Let us walk through a use case based on the sample OpenTelemetry demo application. You can follow this by getting access to AppDynamics Cloud Observability integration.
Business Use case: Track the Total Revenue for this e-commerce application and then further analyze the data based on shipping zip code.
1. Instrumentation | 2. Configuration | 3. Analysis of metric data | 4. Health rule setup | 5. Health alert analysis
Step 1: Instrumentation
The business owner collaborates with developers to instrument the checkout and shipping service. This involves instrumenting order amount and zip code information to be sent as part of the Open Telemetry span attributes as follows:


The above changes result in the app.order.amount and app.shipping.zip_code being added as span attributes for the respective spans for checkout and shipping services. You can visualize the position of those attributes below:
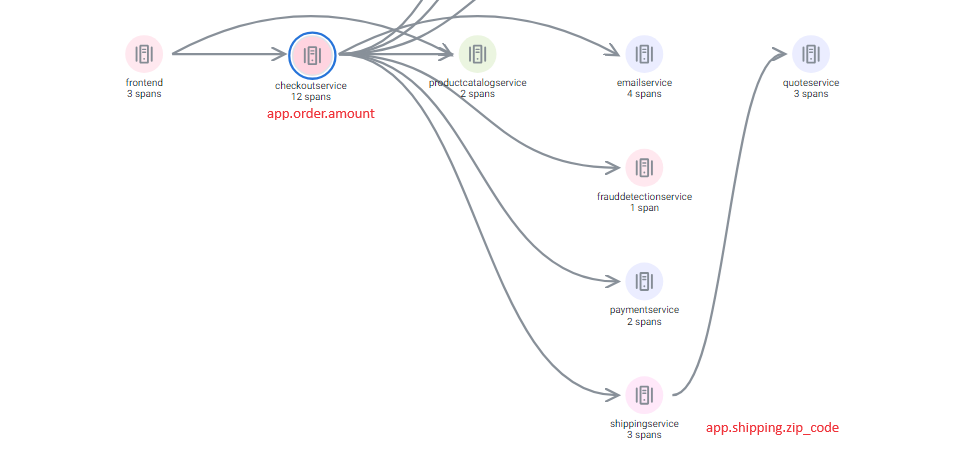

While processing the trace in the cloud, the attributes are scraped and presented for configuration.
Step 2: Configuration
The DevOps owner goes to the checkout business transaction page, navigates to the business metric section, and begins configuration. The “Sum” template is selected for the use case and the metric attribute is selected. The list of metric attributes and data type is generated using the attributes scraped from the trace.
NOTE | The attributes with only summable data type are displayed in the list. The attribute for the zip code is a string and not listed here.
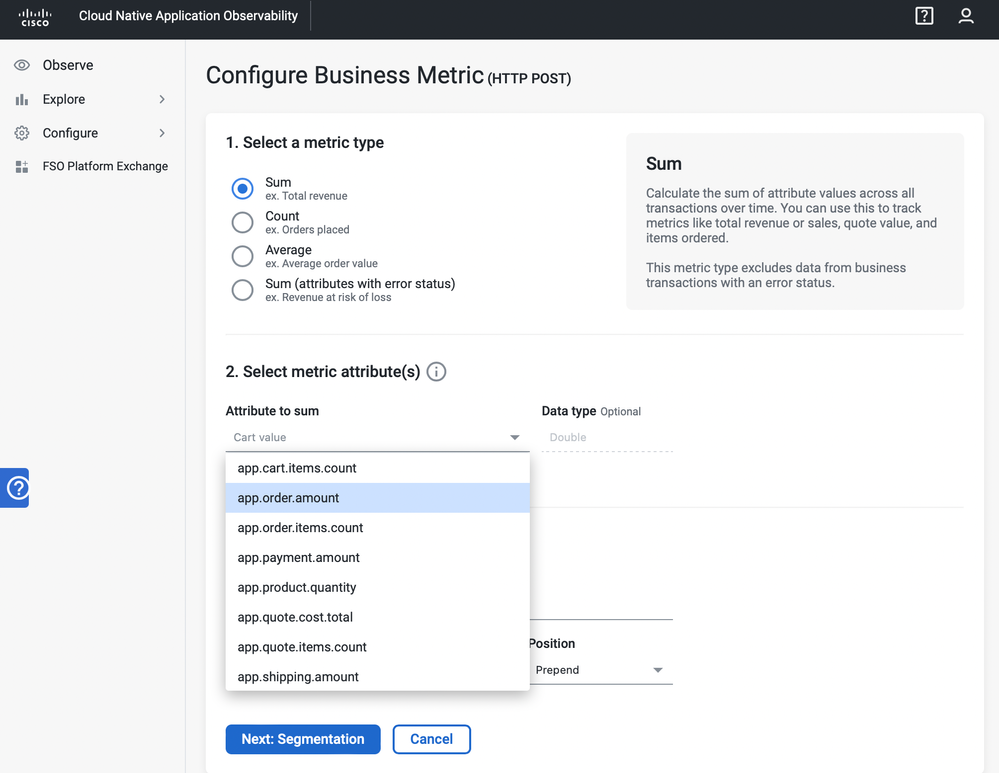
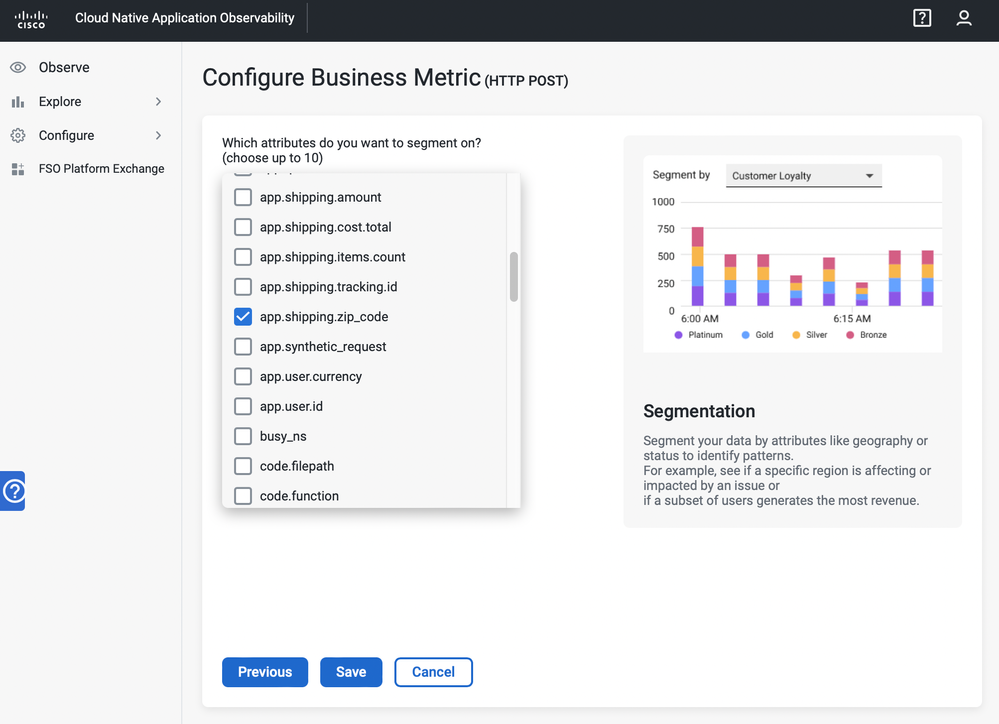
After selecting the desired title for the metric template, the segmentation attributes are selected. In this case, the attribute of interest is zip code, so that is selected. This completes the configuration for the selected use case.
Step 3: Analysis of metric data
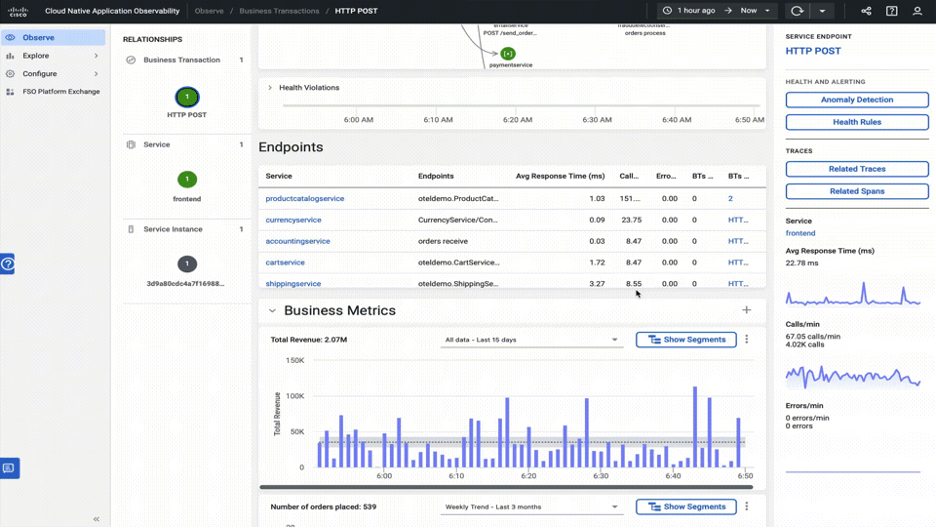
The business owner can now use the configured metric for business analysis. The metric appears on the business transaction page in the Business Metrics section. The business owner can examine the metric data on a timeline as per the global time selector. There are options to show a 15-day, 30-day, or 90-day baseline. For analysis based on segments, the user clicks “Show Segments” to analyze revenue based on zip codes. The individual values can be analyzed by selecting them on the x-axis.
Step 4: Health rule setup
Users can set up health rules to ensure the metric is in the expected range. They should follow the same health rule setup flow as for any other business transaction metric.
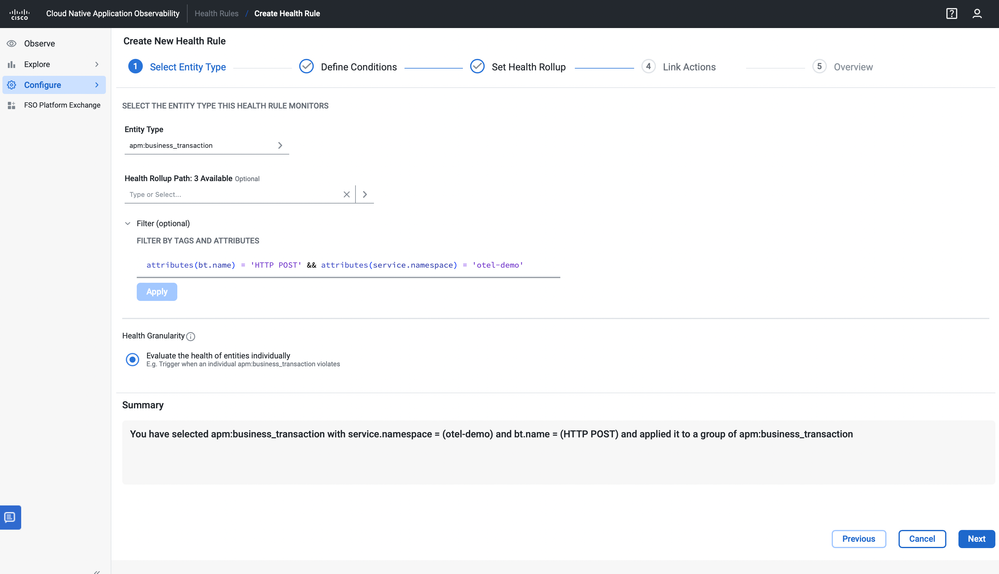
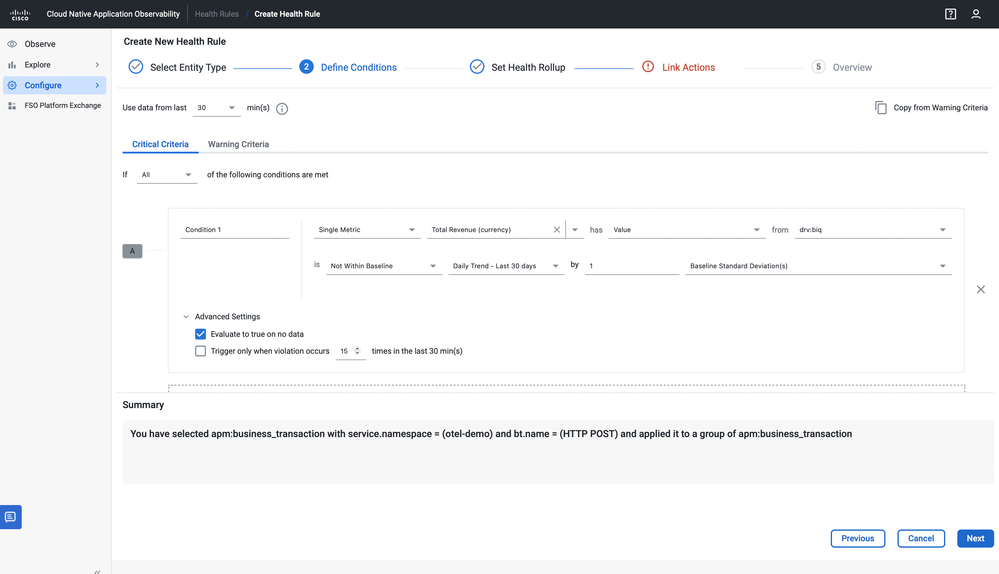
Step 5: Analysis of health alerts
Based on the health rules set up above, the user gets notified of any health rule violation. The user can go to the business transaction page and click on the health rule violation widget that displays the violating metric.
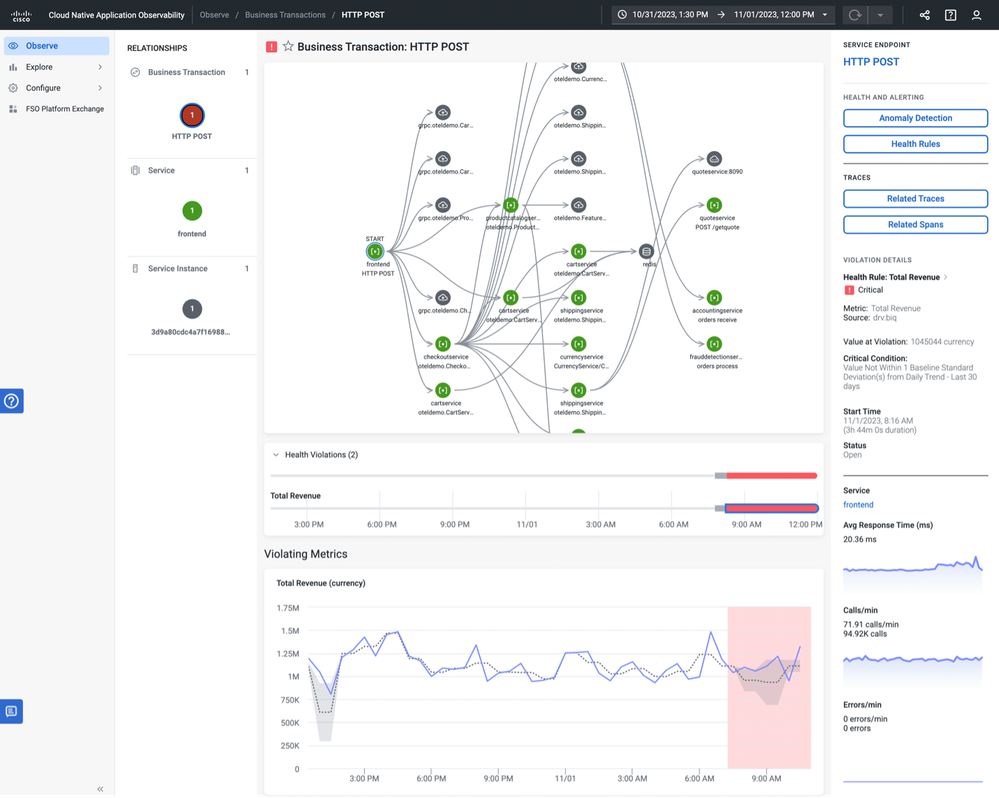
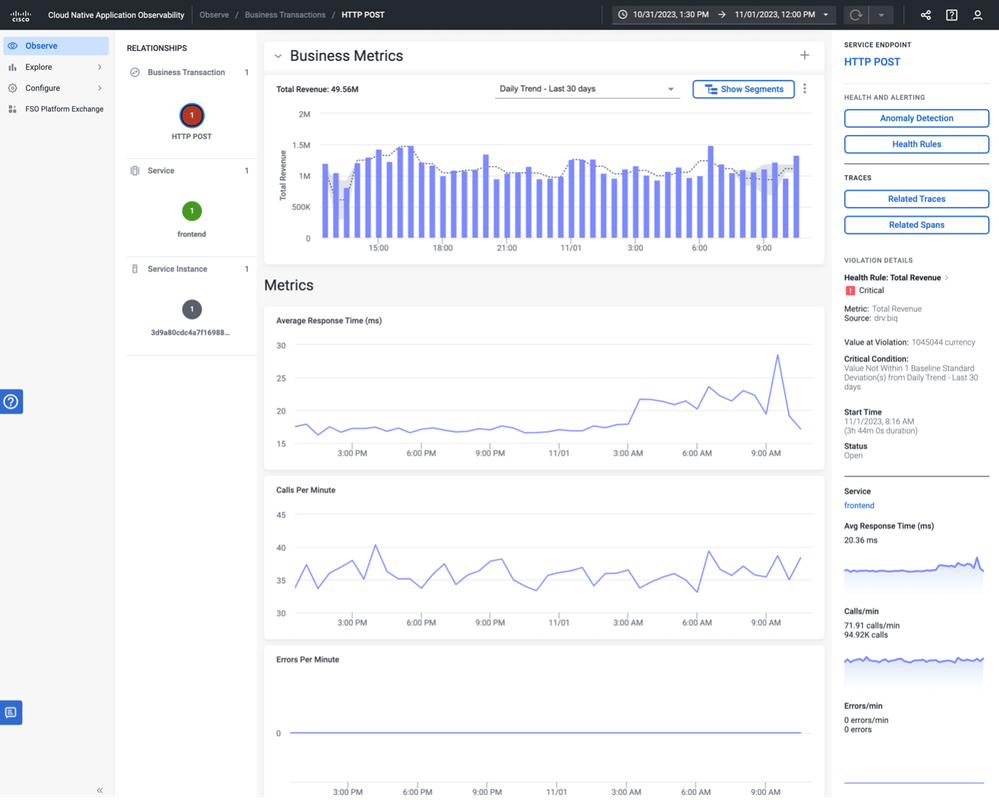
The user can further scroll down to find the cause for the drop by investigating the performance data. This single pane of glass that correlates business metrics with performance data allows the user to find business-affecting performance issues and prioritize them. In this example, the increase in Average Response Time is correlated with the drop in Total Revenue.
Best practices
- During the instrumentation of attributes on spans, we recommend adding a prefix to business attribute names that are distinct from those found in the OTel semantic convention. This will help you to find business attributes during configuration. For example: In the OTel demo, the app.* prefix helps in finding the business attributes.
- We recommend assigning unique attribute names on each span. While gathering attributes from spans of a trace, if a duplicate attribute name is seen, then the latest value is reported.
Figure 12 Attributes with app.* prefix are business attributes and http.* prefix are auto-instrumented attributes.
- While choosing the attributes as dimensions for segmentation, we recommend selecting attributes that don’t have an exceedingly high cardinality. This makes it easier to analyze the data in a segmented view.
Additional resources
- See Configure Business Metrics, under Application Performance Management, Business Transactions in the documentation
Join us on Feb 26 to explore Splunk AppDynamics deployment strategies, SaaS models, agent rollout plans, and expert best practices.
Register Now
Dive into our Community Blog for the Latest Insights and Updates!
Read the blog here

Thank you! Your submission has been received!
Thank you! Your submission has been received!
Oops! Something went wrong while submitting the form