- Community Hub
- Forum Q&A
- Business iQ (Analytics)
- Controller (SaaS, On Premise)
- Dashboards
- Dynamic Languages (Node.JS, Python, PHP, C/C++, Webserver Agent)
- End User Monitoring (EUM)
- Infrastructure (Server, Network, Database)
- Java (Java Agent, Installation, JVM, and Controller Installation)
- Licensing (including Trial)
- .NET (Agent, Installation)
- Smart Agent
- General Discussions
- Resources
- Groups
- Idea Exchange
Not a customer? Click the 'Start a free trial' link to begin a 30-day SaaS trial of our product and to join our community.
Existing Cisco AppDynamics customers should click the 'Sign In' button to authenticate to access the community
- Cisco AppDynamics Community
- Resources
- Knowledge Base
- Tier and Node Life Cycle
- Subscribe to RSS Feed
- Mark as New
- Mark as Read
- Bookmark
- Subscribe
- Printer Friendly Page
- Report Inappropriate Content
At 6pm PST, the AppDynamics Community will go into read-only mode and after migration is complete, you will be redirected to community.splunk.com.
Read more here
- Article History
- Subscribe to RSS Feed
- Mark as New
- Mark as Read
- Bookmark
- Subscribe
- Printer Friendly Page
- Report Inappropriate Content
on 03-06-2015 02:59 PM - edited on 11-19-2018 08:54 AM by Nina.Wolinsky
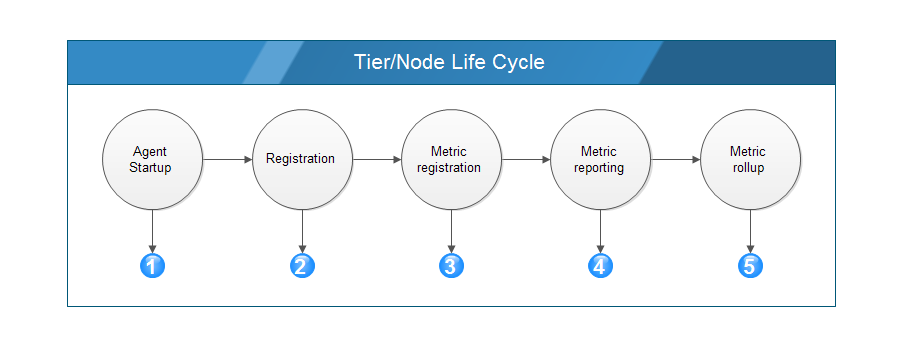
This topic describes the tier and node life cycle within AppDynamics.
A combination of agent logs and REST logs reveal the life cycle details for the tier and node metrics.
Phase 1 - Agent Startup
The application name, tier name, and node name are passed to the agent as part of the start-up process. For Java, the following JVM arguments are used:
- -Dappdynamics.agent.applicationName
- -Dappdynamics.agent.tierName
- -Dappdynamics.agent.nodeName
Example log snippet
[Thread-0] 21 May 2014 21:15:16,041 INFO AgentKernel - JVM Args :
 ...
 |
-javaagent:/apps/appdynamics/current/javaagent.jar |
 -Dappdynamics.controller.hostName=appdynamics.<domain>.net |
 -Dappdynamics.controller.port=8090 |
 -Dappdynamics.agent.applicationName=CL-Tax-WL-prod |
 -Dappdynamics.agent.tierName=GoWeb2-prod |
 -Dappdynamics.agent.nodeName=GoWeb05-02-prod |
 -Dappdynamics.agent.runtime.dir=/apps/Java/GoWeb/appdynamics ...
From these JVM arguments, you can see the application name is CL-Tax-WL-prod, tier name is GoWeb2-prod, and the node name is GoWeb05-02-prod.
-Dappdynamics.agent.applicationName=CL-Tax-WL-prod | -Dappdynamics.agent.tierName=GoWeb2-prod | -Dappdynamics.agent.nodeName=GoWeb05-02-prod
Phase 2 - Registration
The agent sends the registration request to the controller to register the application, tier, and node.
[Thread-0] 21 May 2014 21:15:17,220 INFO ConfigurationChannel - Sending Registration request with: Application Name [CL-Tax-WL-prod], Tier Name [GoWeb2-prod], Node Name [GoWeb05-02-prod], Host Name [fada1wap05] Node Unique Local ID [GoWeb05-02-prod], Version [Server Agent v3.6.1.0 GA #2012-12-11_14-59-42 r2346f2ff54e68a0be000f975f9d0ebc828f8b660 42]
Controller Provides/Confirms the IDs
The component ID is the internal designation for a tier.
[Thread-0] 21 May 2014 21:15:17,982 INFO ConfigurationChannel - Auto agent registration SUCCEEDED!
[Thread-0] 21 May 2014 21:15:17,982 INFO ConfigurationChannel - Registration information received Node ID[153] Component ID[57] Application ID [16]
Phase 3 - Metric Registration
The metrics are reported from each agent/node, and registered with the controller. Tier level metrics look like this in the logs:
BTM|Application Summary|Component:10|Calls per Minute
BTM|Application Summary|Component:10|Exit Call:HTTP|To:14|Calls per Minute
BTM|Application Summary|Component:7|Exit Call:JDBC|To:{[UNRESOLVED][9]}|Calls per Minute
Log entries from the agent logs for metric registration and reporting for these tier-level metrics:
- Calls per Minute
- Errors per Minute
- Stall Count
- Number of Slow Calls
[AD Thread-Metric Reporter0] 21 Mar 2014 11:28:30,708 DEBUG MetricHandler - 0 BTM|Application Summary|Component:16|Calls per Minute 28 UNREGISTERED 612018265
[AD Thread-Metric Reporter0] 21 Mar 2014 11:28:30,707 DEBUG MetricHandler - 0 BTM|Application Summary|Component:16|Errors per Minute 0 UNREGISTERED 277551759
[AD Thread-Metric Reporter0] 21 Mar 2014 11:28:30,708 DEBUG MetricHandler - 0 BTM|Application Summary|Component:16|Stall Count 0 UNREGISTERED 2010399551
[AD Thread-Metric Reporter0] 21 Mar 2014 11:28:30,708 DEBUG MetricHandler - 0 BTM|Application Summary|Component:16|Number of Slow Calls 0 UNREGISTERED 1630292838
Metric IDs applied to the unregistered metrics:
[AD Thread-Metric Reporter0] 21 Mar 2014 11:28:40,706 DEBUG MetricHandler - adding unregistered metric BTM|Application Summary|Component:16|Errors per Minute
[AD Thread-Metric Reporter0] 21 Mar 2014 11:28:40,707 DEBUG MetricHandler - adding unregistered metric BTM|Application Summary|Component:16|Stall Count
[AD Thread-Metric Reporter0] 21 Mar 2014 11:28:40,707 DEBUG MetricHandler - adding unregistered metric BTM|Application Summary|Component:16|Number of Slow Calls
[AD Thread-Metric Reporter0] 21 Mar 2014 11:28:40,707 DEBUG MetricHandler - adding unregistered metric BTM|BTs|BT:241|Component:16|Errors per Minute
The following logs show the assignment of the metric ID to specific metrics. These logs are found in the REST log files.
<metric id="7527" name="BTM\|Application Summary\|Component:16\|Number of Slow Calls"/>
<metric id="7499" name="BTM\|BTs\|BT:241\|Component:16\|Errors per Minute"/>
<metric id="7526" name="BTM\|Application Summary\|Component:16\|Stall Count"/>
<metric id="7530" name="BTM\|Application Summary\|Component:16\|Calls per Minute"/>
Phase 4 - Metric Reporting
Metrics reported using the metric IDs. These logs are from the REST log files.
<metric id='7527', value\[sum=0, count=1, min=0, max=0, current=0\]>
<metric id='7499', value\[sum=0, count=1, min=0, max=0, current=0\]>
<metric id='7526', value\[sum=0, count=1, min=0, max=0, current=0\]>
<metric id='7530', value\[sum=28, count=1, min=28, max=28, current=28\]>
Phase 5 - Metric Rollup
This stage happens at the controller.
The metrics from all nodes are rolled up in the controller according to the values of time-rollup-type and cluster-rollup-type that was specified at the time of metric registration.
The metric registration logs can be found in the REST log. They look similar to the following:
<node-id>35</node-id>
<agent-type>APP_AGENT</agent-type>
<metric time-rollup-type="AVERAGE" name="BTM|Application Summary|Component:16|Errors per Minute" hole-fill-type="RATE_COUNTER" cluster-rollup-type="COLLECTIVE"/>
<metric time-rollup-type="AVERAGE" name="BTM|Application Summary|Component:16|Infrastructure Errors per Minute" hole-fill-type="RATE_COUNTER" cluster-rollup-type="COLLECTIVE"/>

<metric time-rollup-type="SUM" name="BTM|Application Summary|Number of Slow Calls" hole-fill-type="REGULAR_COUNTER" cluster-rollup-type="COLLECTIVE"/>
<metric time-rollup-type="SUM" name="BTM|Application Summary|Stall Count" hole-fill-type="REGULAR_COUNTER" cluster-rollup-type="COLLECTIVE"/>

<metric time-rollup-type="SUM" name="BTM|Application Summary|Component:16|Stall Count" hole-fill-type="REGULAR_COUNTER" cluster-rollup-type="COLLECTIVE"/>
<metric time-rollup-type="SUM" name="BTM|Application Summary|Component:16|Number of Slow Calls" hole-fill-type="REGULAR_COUNTER" cluster-rollup-type="COLLECTIVE"/>
<metric time-rollup-type="SUM" name="BTM|Application Summary|Number of Slow End to End Messages" hole-fill-type="REGULAR_COUNTER" cluster-rollup-type="COLLECTIVE"/>
Join us on Feb 26 to explore Splunk AppDynamics deployment strategies, SaaS models, agent rollout plans, and expert best practices.
Register Now
Dive into our Community Blog for the Latest Insights and Updates!
Read the blog here

Thank you! Your submission has been received!
Thank you! Your submission has been received!
Oops! Something went wrong while submitting the form
