- Community Hub
- Forum Q&A
- Business iQ (Analytics)
- Controller (SaaS, On Premise)
- Dashboards
- Dynamic Languages (Node.JS, Python, PHP, C/C++, Webserver Agent)
- End User Monitoring (EUM)
- Infrastructure (Server, Network, Database)
- Java (Java Agent, Installation, JVM, and Controller Installation)
- Licensing (including Trial)
- .NET (Agent, Installation)
- Smart Agent
- General Discussions
- Resources
- Groups
- Idea Exchange
Not a customer? Click the 'Start a free trial' link to begin a 30-day SaaS trial of our product and to join our community.
Existing Cisco AppDynamics customers should click the 'Sign In' button to authenticate to access the community
- Cisco AppDynamics Community
- Resources
- Knowledge Base
- How do I display and publish metrics data with Mic...
- Subscribe to RSS Feed
- Mark as New
- Mark as Read
- Bookmark
- Subscribe
- Printer Friendly Page
- Report Inappropriate Content
- Article History
- Subscribe to RSS Feed
- Mark as New
- Mark as Read
- Bookmark
- Subscribe
- Printer Friendly Page
- Report Inappropriate Content
on 06-05-2020 10:02 AM - edited on 05-06-2024 03:29 PM by Ryan.Paredez
Now that I have downloaded metrics from AppDynamics’ Metrics and Snapshots API and converted them into a useful Microsoft Power BI data source, how do I visualize and publish that data?
Part 2 of 2
In Part 1 of this series, we retrieved the metric data from AppDynamics REST API, and then converted JSON into a table in Power Query Editor. In this article (Part 2), we will add visualizations to that table and publish the results to Power BI Online.
In this article...
Visualize the Data in Power BI
- Build the line graph visualization
- Experiment with updating of the query parameters
- Change Application Parameter
- Change Metric Path Parameter
Publishing your report to Power BI Online
- Power BI Online Settings for publication
- Updating the report in Power BI
- Settings for an automatic refresh
- Refresh your report in Power BI Online
Resources
Visualize The Data in Power BI
Build the line graph visualization
- In Visual Designer, insert new Line Chart visual from the Visualizations pane
- Resize the visual to your desired shape
- Add the value field to Values property of Line Chart visual
- Add EventTime field to Axis property of Line Chart visual
- Click on the down-pointing arrow on EventTime in Axis property of Line Chart visual and change selection to EventTime
The Results should look like this:Power BI Visual Designer: building the line graph visualization
You can adjust visualization properties on the Format section of the Line Chart visual to move Legend.
Congratulations, your visualizations are now complete.
Experiment with updating of the query parameters
You can now experiment with changing of APM Application, Metric Path, and Time Range
- Click the Home\Queries\Transform Data\Edit Parameters button on the ribbon
- Adjust the parameters as needed:
Power BI Visual Designer: Modify parameters as needed
- Click Apply Changes on the Pending Changes gold bar or click Home\Queries\Refresh to retrieve data from API call again
Change Application Parameter
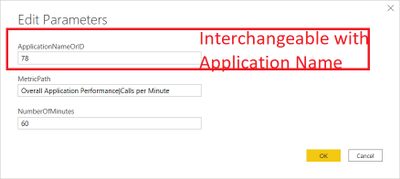
The application ID can either be the name or the ID of an application. You can retrieve the application ID from the URL of your browser, or from Application Model API.
For example, here is the use of ApplicationID:
Change Metric Path Parameter
You can change Metric Path to use any explicit or wildcard metric path (See Metric and Snapshot API, Using Wildcards). 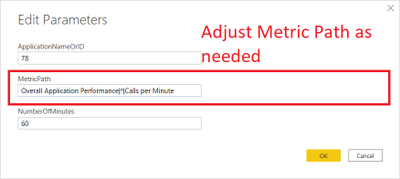
The results of this should look like this for all Tiers: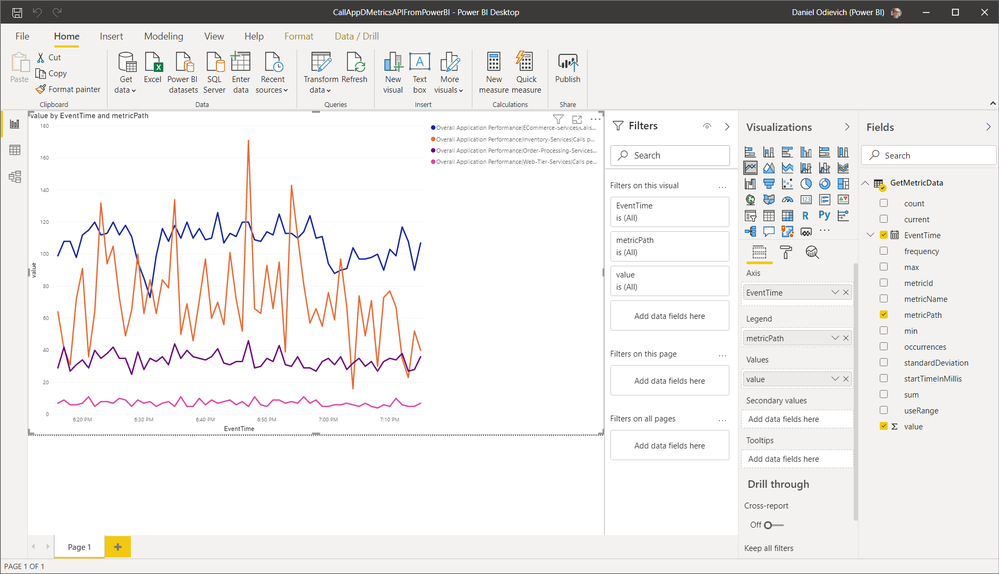
Or like this for Backends: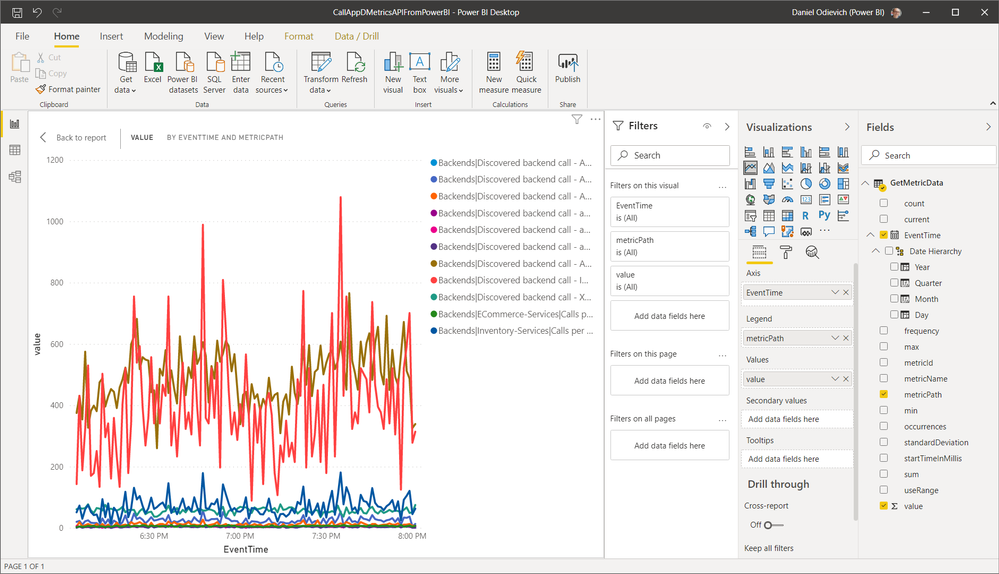
Examples of relevant Metric Path wildcards
|
Metric |
Purpose |
|
Overall Application Performance|Calls per Minute |
CPM for entire Application |
|
Overall Application Performance|*|Calls per Minute |
CPM for all Tiers in Application |
|
Overall Application Performance|*|* |
All metrics for all Tiers in Application |
|
Application Infrastructure Performance|*|Hardware Resources|CPU|%Busy |
CPU Usage for All Tiers in Application |
|
Overall Application Performance|*|Individual Nodes|*|Calls per Minute |
CPM for all Nodes in all Tiers in Application |
|
Application Infrastructure Performance|*|Individual Nodes|*|Hardware Resources|CPU|%Busy |
CPU Usage for all Nodes in all Tiers in Application |
|
Backends|*|Calls per Minute |
CPM for all Backends in Application |
|
Business Transaction Performance|Business Transactions|*|*|Calls per Minute |
CPM for all Business Transactions in all Tiers in Application |
|
Service Endpoints|*|*|Calls per Minute |
CPM for all Service Endpoints in all Tiers in Application |
|
Errors|*|*|Errors per Minute |
CPM for all Errors in all Tiers in Application |
|
Information Points|*|Calls per Minute |
CPM for all Information Points in Application |
Change Time Range Parameter
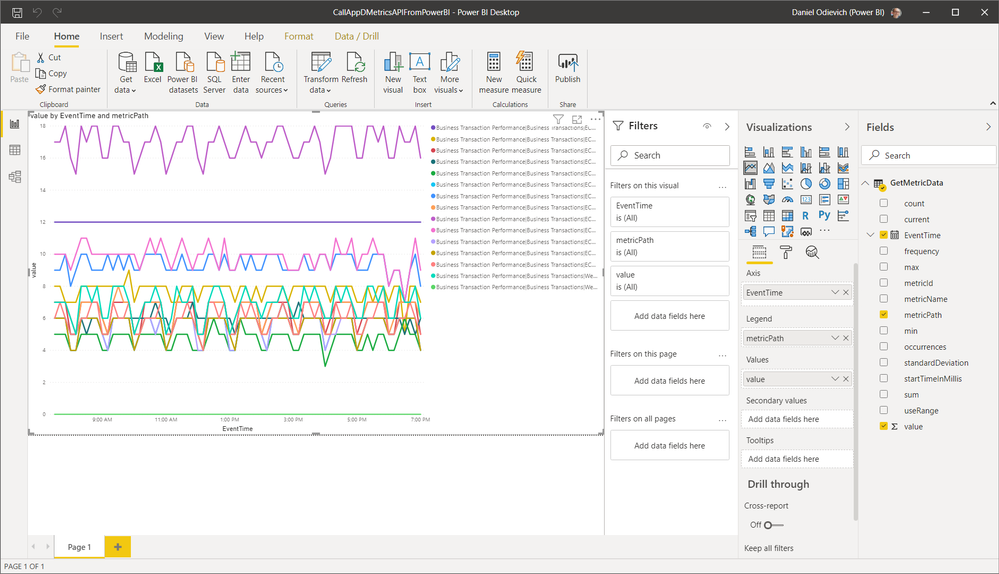
You can expand the time range by adjusting NumberOfMinutes parameter: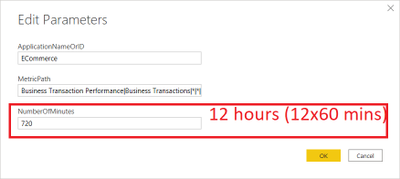
The results should look like this:
Publishing your report to Power BI Online
Microsoft Power BI Online service can display results of the PBIX file in a web browser after you publish. For this to work, your organization must be licensed for Power BI Online, and you must sign into that service with valid credentials from inside Power BI Desktop.
- Power BI Online Settings for publication
- Updating the report in Power BI
- Settings for an automatic refresh
- Refresh your report in Power BI Online
Power BI Online Settings for publication
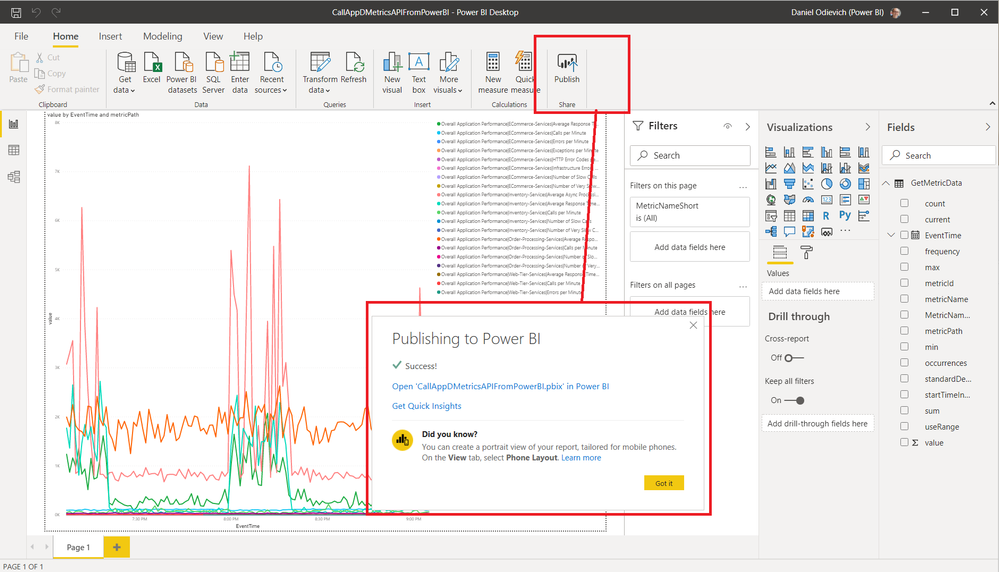
- Click Home\Share\Publish button on the ribbon
- Specify the Power BI Online workspace from the list of those to which you have permissions
- Wait until publish is complete
- After publishing, you can open your report in the web browser:
Updating the report in Power BI
- If you want to update the report in Power BI Online, you’ll need to specify credentials as described on https://docs.microsoft.com/en-us/power-bi/connect-data/service-parameters in
Settings\Datasets\<yourdatasetname>\Data source credentials\Web\Edit credentials - Then, you can update parameters in
Settings\Datasets\<yourdatasetname>\Data source credentials\Parameters
Settings for an automatic refresh
You can also schedule an automatic refresh using the "Settings\Datasets\<yourdatasetname>\Data source credentials\Scheduled refresh" feature:
Refresh your report in Power BI Online
- Navigate to the Datasets tab
- Click the Actions\Refresh button
Manual data refresh
- Finally, refresh the actual Report using the "Refresh" icon on the ribbon
Resources
Tutorial Part 1: How do I retrieve metrics and so I can display them with Microsoft Power BI? - Part 1
- Mark as Read
- Mark as New
- Bookmark
- Permalink
- Report Inappropriate Content
Hi Claudia,
Example link is broken.Can you update link?
I have a question.
In an example application, can I see the output of Avg resp time > 3000ms and call/min < 10 as an operation? Can we plot this according to the response time call min values that I will specify as api?
- Mark as Read
- Mark as New
- Bookmark
- Permalink
- Report Inappropriate Content
Hi, @apm.turkey
Thanks for pointing out that broken link. I'll hunt down an update, as well as an expert to answer your question.
Claudia
- Mark as Read
- Mark as New
- Bookmark
- Permalink
- Report Inappropriate Content
Is anyone using this? Looks interesting but would like some real world examples. Pluses and minuses compared to Appdynamics custom dashboards?
Join us on Feb 26 to explore Splunk AppDynamics deployment strategies, SaaS models, agent rollout plans, and expert best practices.
Register Now
Dive into our Community Blog for the Latest Insights and Updates!
Read the blog here

Thank you! Your submission has been received!
Thank you! Your submission has been received!
Oops! Something went wrong while submitting the form
