- Community Hub
- Forum Q&A
- Business iQ (Analytics)
- Controller (SaaS, On Premise)
- Dashboards
- Dynamic Languages (Node.JS, Python, PHP, C/C++, Webserver Agent)
- End User Monitoring (EUM)
- Infrastructure (Server, Network, Database)
- Java (Java Agent, Installation, JVM, and Controller Installation)
- Licensing (including Trial)
- .NET (Agent, Installation)
- Smart Agent
- General Discussions
- Resources
- Groups
- Idea Exchange
Not a customer? Click the 'Start a free trial' link to begin a 30-day SaaS trial of our product and to join our community.
Existing Cisco AppDynamics customers should click the 'Sign In' button to authenticate to access the community
- Cisco AppDynamics Community
- Resources
- Knowledge Base
- Extending CDEM to correlate network insights with ...
- Subscribe to RSS Feed
- Mark as New
- Mark as Read
- Bookmark
- Subscribe
- Printer Friendly Page
- Report Inappropriate Content
- Article History
- Subscribe to RSS Feed
- Mark as New
- Mark as Read
- Bookmark
- Subscribe
- Printer Friendly Page
- Report Inappropriate Content
on
12-14-2023
09:30 AM
- edited on
12-14-2023
09:48 AM
by
Claudia.Landiva
Enhance full-stack observability by correlating Mobile Real User Monitoring (Mobile RUM) with network intelligence
In this article...
- What is Customer Digital Experience Monitoring (CDEM)?
- CDEM offers two-way data flow and analysis across stacks in real time
- Additional resources
What is Customer Digital Experience Monitoring (CDEM)?
In June 2023, Cisco released Customer Digital Experience Monitoring (CDEM) – a bi-directional integration between AppDynamics™ and ThousandEyes™- which extended Cisco’s Full Stack Observability by combining application, network and user experience monitoring to provide powerful customer digital experience monitoring. It helps our customers to:
- Proactively identify gaps in monitoring and deliver optimal digital experiences to their users
- Correlate inferior user experiences over customer applications attributed due to network issues
- Reduce MTTR and prioritize network remediation based on the business impact due to user experience issues
This integration offers a powerful correlation between network insights and customer’s application experience their users face, over their respective web browsers.
CDEM offers two-way data flow and analysis across stacks in real time
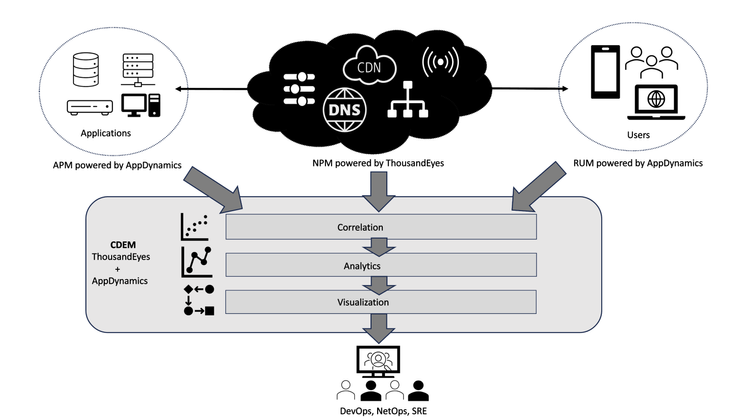
There is a real-time flow of data across APM, RUM and NPM stacks which is further correlated in near-real time and then analyzed and presented over insightful visualization.
AppDynamics APM
|
Helps in monitoring and managing the performance of applications by providing real-time insights into the performance of the application itself, including metrics related to response times, errors, and resource utilization. |
AppDynamics RUM
|
Involves tracking and monitoring the experience of real users interacting with an application. It provides insights into how users are experiencing the application, including details about page load times, user interactions, and more. |
ThousandEyes NPM
|
Helps in monitoring the performance of internet infrastructure — including factors like network latency, packet loss, and bandwidth utilization.
|
By correlating network insights for similar network domains between NPM, APM, and RUM stacks, we provide our customers with full-stack observability across these stacks, packaged as the CDEM offering.
Adding to our current correlation between network performance and user experience over web browsers, this release includes mobile applications as well.
How do I correlate data across APM, RUM and NPM domains?
In AppDynamics, applications are the entities that contain application performance insights and associated user experience data to provide business observability. These applications contain network domains against which ThousandEyes network tests can be configured for getting regular network insights.
- Data from common entities across domains including metrics related to application performance, user experience, and network performance is collected.
- The collected data is correlated to identify patterns or relationships. This involves associating network performance issues with user experience metrics and eventually with application performance metrics.
- Once the data is correlated, it is analyzed to gain insights. This analysis can help identify the root causes of performance issues and can be used to optimize the application and network.
- The insights are presented through visualization tools. These tools might create dashboards, charts, and reports to make the information more accessible and actionable for users.
Latest CDEM updates extended 2-way information sharing to now include Mobile RUM (MRUM)
RUM is further categorized into Browser RUM (BRUM) and Mobile RUM (MRUM). Early this year, we launched CDEM to integrate ThousandEyes network insights with Browser RUM. In the current release, we have extended it to include Mobile RUM as well.
With bi-directional information sharing between MRUM, APM and NPM, this solution eliminates silos and provides end-to-end visibility to every team, all from within Cisco AppDynamics. It helps isolate issues like slow mobile application responsiveness due to network issues by visualizing aggregated mobile application user experience metrics along with network metrics across the same timelines.
Additional resources
- AppDynamics SaaS documentation: End User Monitoring
- In the Blog: Mobile Real User Monitoring and Cisco ThousandEyes Integration
Learn how Splunk and AppDynamics are redefining observability
Watch Now!
Dive into our Community Blog for the Latest Insights and Updates!
Read the blog here

Thank you! Your submission has been received!
Thank you! Your submission has been received!
Oops! Something went wrong while submitting the form
