- Community Hub
- Forum Q&A
- Business iQ (Analytics)
- Controller (SaaS, On Premise)
- Dashboards
- Dynamic Languages (Node.JS, Python, PHP, C/C++, Webserver Agent)
- End User Monitoring (EUM)
- Infrastructure (Server, Network, Database)
- Java (Java Agent, Installation, JVM, and Controller Installation)
- Licensing (including Trial)
- .NET (Agent, Installation)
- Smart Agent
- General Discussions
- Resources
- Groups
- Idea Exchange
Not a customer? Click the 'Start a free trial' link to begin a 30-day SaaS trial of our product and to join our community.
Existing Cisco AppDynamics customers should click the 'Sign In' button to authenticate to access the community
- Cisco AppDynamics Community
- Resources
- Knowledge Base
- Why does the embedded Event-Service Process get hu...
- Subscribe to RSS Feed
- Mark as New
- Mark as Read
- Bookmark
- Subscribe
- Printer Friendly Page
- Report Inappropriate Content
At 6pm PST, the AppDynamics Community will go into read-only mode and after migration is complete, you will be redirected to community.splunk.com.
Read more here
- Article History
- Subscribe to RSS Feed
- Mark as New
- Mark as Read
- Bookmark
- Subscribe
- Printer Friendly Page
- Report Inappropriate Content
on 10-17-2016 03:50 AM - edited on 11-28-2018 04:14 PM by Nina.Wolinsky
Symptoms
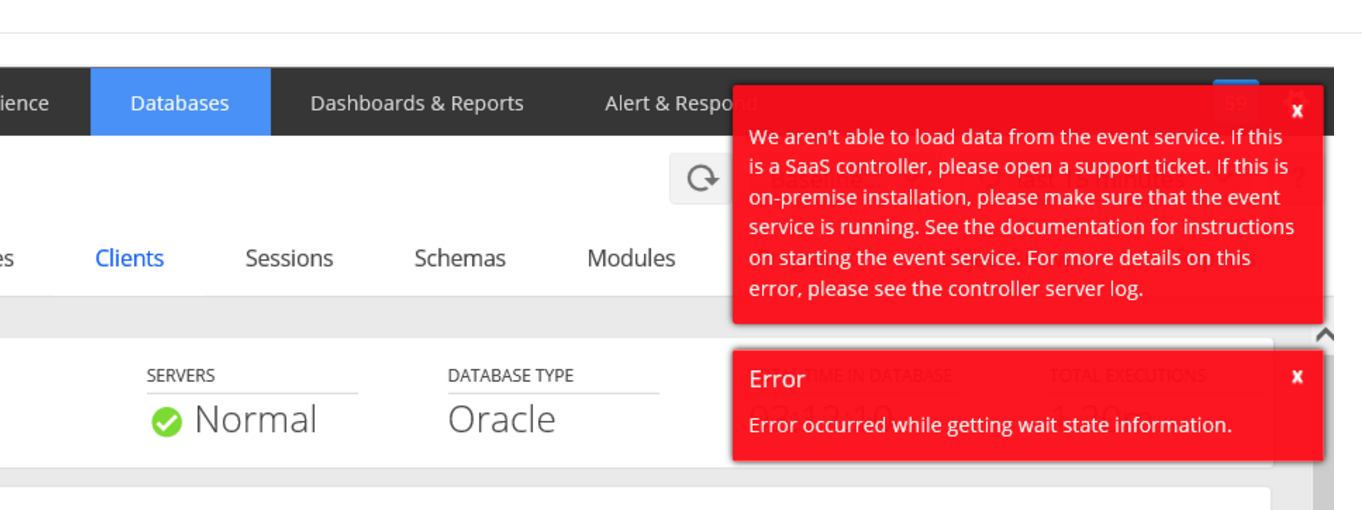
We have come across an issue where the Database was not reporting the events data but was throwing an error message as "We aren't able to load data from the event service" as shown in the below image.
The controller's server.log and the error message in the above image indicate that the event-service process might have been stopped/died and hence need a restart of the same.
Snippet from the controller's server.log:
0500|SEVERE|glassfish3.1.2|com.singularity.ee.controller.beans.ExceptionHandlingInterceptor|_ThreadID=120;_ThreadName=Thread-5;|Encountered runtime exception com.appdynamics.analytics.shared.rest.exceptions.ClientException: Could not execute request to http://localhost:9080/v2/events/dbmon-wait-time
atcom.appdynamics.analytics.shared.rest.client.utils.GenericHttpRequestBuilder.getResponse(GenericHttpRequestBuilder.java:224)
atcom.appdynamics.analytics.shared.rest.client.utils.GenericHttpRequestBuilder.executeAndReturnRawResponseString(GenericHttpRequestBuilder.java:238)
atcom.appdynamics.analytics.shared.rest.client.eventservice.DefaultEventServiceClient.registerEventType(DefaultEventServiceClient.java:132)
Restart of the event Service didn't help as the issue persisted with the same SEVERE message in the logs as shown in the snippet above.
<Controller_Install_Dir>/bin/controller.sh start-events-service
Diagnosis
As part of the troubleshooting check list,we carried out the below stuff in sequence to find out the root cause of the issue.
1. We could infer that the process id existed from the output of the ps -ef | grep -i event-service command
52676 11537 1 0 03:58 pts/3 00:00:11 /opt/AppDynamics/Controller/jre/bin/java -Xmx6144m -Xms6144m -Xss256k -Djava.net.preferIPv4Stack=true -Dfile.encoding=UTF-8 -XX:+UseParNewGC -XX:+UseConcMarkSweepGC -XX:CMSInitiatingOccupancyFraction=75 -XX:+UseCMSInitiatingOccupancyOnly -XX:+DisableExplicitGC -XX:+PrintGCDetails -XX:+PrintGCDateStamps -XX:+PrintGCTimeStamps -XX:+PrintClassHistogram -XX:+PrintTenuringDistribution -XX:+PrintGCApplicationStoppedTime -XX:+PrintPromotionFailure -verbose:gc -XX:GCLogFileSize=256m -XX:NumberOfGCLogFiles=4 -XX:+UseGCLogFileRotation -Xloggc:/opt/AppDynamics/Controller/events_service/bin/../logs/events-service-api-store-gc.log -DAPPLICATION_HOME=/opt/AppDynamics/Controller/events_service/bin/.. -classpath /opt/AppDynamics/Controller/events_service/bin/../lib/* com.appdynamics.analytics.processor.AnalyticsService -p /opt/AppDynamics/Controller/events_service/conf/events-service-api-store.properties -y /opt/AppDynamics/Controller/events_service/bin/../conf/events-service-api-store.yml 52676 19976 9765 0 04:38 pts/3 00:00:00 grep events-service
2. We then checked the health state of the event-service but it didn't respond to any request.
curl http://<event-service-host>:9081/healthcheck?pretty=true
3. Then we check if the host and port of the event-service is binded correctly using the netstat command but we didn't see the LISTEN state for 9080 port as the command didn't return anything.
netstat -anp | grep 9080
4. We then realized that the process might have been hung/unresponsvie during the startup and hence captured five sets of thread dumps to find out the thread that's hung and where exactly it was hung.
We used kill -3 52676 (kill -3 <PID>) to capture the thread dumps and *NOTE* that java thread dump output goes to "stdout" and hence it will be written to the nohup.out stdout file of the event-service.
5. Upon analyzing all the thread dumps,we found out that the main thread was hung as seen below as it was stuck at the native layer(sun.nio.fs.UnixNativeDispatcher.stat0(Native Method)) and was not progressing at all in the successive thread dumps.
Stack Trace of the Hung Thread:
"main" #1 prio=5 os_prio=0 tid=0x00007fdb84011000 nid=0xe280 runnable [0x00007fdb88425000]
java.lang.Thread.State: RUNNABLE
at sun.nio.fs.UnixNativeDispatcher.stat0(Native Method)
at sun.nio.fs.UnixNativeDispatcher.stat(UnixNativeDispatcher.java:286)
at sun.nio.fs.UnixFileAttributes.get(UnixFileAttributes.java:70)
at sun.nio.fs.UnixFileStore.devFor(UnixFileStore.java:55)
at sun.nio.fs.UnixFileStore.(UnixFileStore.java:70)
at sun.nio.fs.LinuxFileStore.(LinuxFileStore.java:48)
at sun.nio.fs.LinuxFileSystem.getFileStore(LinuxFileSystem.java:112)
at sun.nio.fs.UnixFileSystem$FileStoreIterator.readNext(UnixFileSystem.java:213)
at sun.nio.fs.UnixFileSystem$FileStoreIterator.hasNext(UnixFileSystem.java:224)
- locked <0x000000065610cb50> (a sun.nio.fs.UnixFileSystem$FileStoreIterator)
at org.elasticsearch.env.NodeEnvironment.getFileStore(NodeEnvironment.java:267)
at org.elasticsearch.env.NodeEnvironment.access$000(NodeEnvironment.java:62)
at org.elasticsearch.env.NodeEnvironment$NodePath.(NodeEnvironment.java:75)
at org.elasticsearch.env.NodeEnvironment.(NodeEnvironment.java:140)
at org.elasticsearch.node.internal.InternalNode.(InternalNode.java:165)
at org.elasticsearch.node.NodeBuilder.build(NodeBuilder.java:159)
at org.elasticsearch.node.NodeBuilder.node(NodeBuilder.java:166)
at com.appdynamics.analytics.processor.elasticsearch.node.single.ElasticSearchSingleNode.(ElasticSearchSingleNode.java:49)
at com.appdynamics.analytics.processor.elasticsearch.node.single.ElasticSearchSingleNode$$FastClassByGuice$$7b182632.newInstance() at com.google.inject.internal.cglib.reflect.$FastConstructor.newInstance(FastConstructor.java:40)
at com.google.inject.internal.DefaultConstructionProxyFactory$1.newInstance(DefaultConstructionProxyFactory.java:60)
at com.google.inject.internal.ConstructorInjector.construct(ConstructorInjector.java:85)
at com.google.inject.internal.ConstructorBindingImpl$Factory.get(ConstructorBindingImpl.java:254)
at com.google.inject.internal.ProviderToInternalFactoryAdapter$1.call(ProviderToInternalFactoryAdapter.java:46)
at com.google.inject.internal.InjectorImpl.callInContext(InjectorImpl.java:1031)
at com.google.inject.internal.ProviderToInternalFactoryAdapter.get(ProviderToInternalFactoryAdapter.java:40)
at com.google.inject.Scopes$1$1.get(Scopes.java:65)
- locked <0x00000006534a90f0> (a java.lang.Class for com.google.inject.internal.InternalInjectorCreator)
at com.google.inject.internal.InternalFactoryToProviderAdapter.get(InternalFactoryToProviderAdapter.java:40)
at com.google.inject.internal.SingleFieldInjector.inject(SingleFieldInjector.java:53)
at com.google.inject.internal.MembersInjectorImpl.injectMembers(MembersInjectorImpl.java:110)
at com.google.inject.internal.MembersInjectorImpl$1.call(MembersInjectorImpl.java:75)
at com.google.inject.internal.MembersInjectorImpl$1.call(MembersInjectorImpl.java:73)
at com.google.inject.internal.InjectorImpl.callInContext(InjectorImpl.java:1024)
at com.google.inject.internal.MembersInjectorImpl.injectAndNotify(MembersInjectorImpl.java:73)
at com.google.inject.internal.MembersInjectorImpl.injectMembers(MembersInjectorImpl.java:60)
at com.google.inject.internal.InjectorImpl.injectMembers(InjectorImpl.java:944)
at com.appdynamics.common.framework.Loaders.internalPrepareAndPreStart(Loaders.java:181)
at com.appdynamics.common.framework.Loaders.loadAndInitializeModules(Loaders.java:127)
at com.appdynamics.common.framework.AbstractApp.run(AbstractApp.java:311)
at com.appdynamics.common.framework.AbstractApp.run(AbstractApp.java:59)
at io.dropwizard.cli.EnvironmentCommand.run(EnvironmentCommand.java:42)
at io.dropwizard.cli.ConfiguredCommand.run(ConfiguredCommand.java:76)
at io.dropwizard.cli.Cli.run(Cli.java:70) at io.dropwizard.Application.run(Application.java:72)
at com.appdynamics.common.framework.AbstractApp.callRunServer(AbstractApp.java:267)
at com.appdynamics.common.framework.AbstractApp.runUsingFile(AbstractApp.java:261)
at com.appdynamics.common.framework.AbstractApp.runUsingTemplate(AbstractApp.java:248)
at com.appdynamics.common.framework.AbstractApp.runUsingTemplate(AbstractApp.java:167)
at com.appdynamics.analytics.processor.AnalyticsService.main(AnalyticsService.java:71)
6. Further reading of the stack trace clearly indicates some kind of a file system issue and hence we checked for any kind of NFS Mount hung issue with the OS admin.
7. OS admin confirm that the NFS Mount was indeed hung which was caused due to the server got migrated to the new host which caused the NFS Mount hung.
8. Unmounting and remounting with the correct mount point should resolve the hung NFS mount issue.
Solution
The solution was to fix the NFS Mount hung. The event-service process then started up just fine and the DB-Mon started reflecting the events data correctly.
Join us on Feb 26 to explore Splunk AppDynamics deployment strategies, SaaS models, agent rollout plans, and expert best practices.
Register Now
Dive into our Community Blog for the Latest Insights and Updates!
Read the blog here

Thank you! Your submission has been received!
Thank you! Your submission has been received!
Oops! Something went wrong while submitting the form
