- Community Hub
- Forum Q&A
- Business iQ (Analytics)
- Controller (SaaS, On Premise)
- Dashboards
- Dynamic Languages (Node.JS, Python, PHP, C/C++, Webserver Agent)
- End User Monitoring (EUM)
- Infrastructure (Server, Network, Database)
- Java (Java Agent, Installation, JVM, and Controller Installation)
- Licensing (including Trial)
- .NET (Agent, Installation)
- Smart Agent
- General Discussions
- Resources
- Groups
- Idea Exchange
Not a customer? Click the 'Start a free trial' link to begin a 30-day SaaS trial of our product and to join our community.
Existing Cisco AppDynamics customers should click the 'Sign In' button to authenticate to access the community
- Cisco AppDynamics Community
- Forums Q&A
- Java
- Re: Maximum Metric Count per minute
- Subscribe to RSS Feed
- Mark Topic as New
- Mark Topic as Read
- Float this Topic for Current User
- Bookmark
- Subscribe
- Mute
- Printer Friendly Page
Maximum Metric Count per minute
- Mark as New
- Bookmark
- Subscribe
- Mute
- Subscribe to RSS Feed
- Permalink
- Report Inappropriate Content
01-29-2018 04:37 AM
Hi,
Can any one please advise on the below.
I am planning to upgrade our AppD controller from Version 4.2.x to 4.4.x and would like to know if there is an easier way of working out what our current "Metric Count per Minute" is. Is it possible to find out what this value is from the Controller UI (as opposed to running database query)?
Thanks
Moses
- Mark as New
- Bookmark
- Subscribe
- Mute
- Subscribe to RSS Feed
- Permalink
- Report Inappropriate Content
01-29-2018 06:44 AM
Hi Moses,
You can create an information point on the internal agent monitoring controller to get a metric count on the controller UI.
Login in to the internal controller: /controller/admin.jsp
Navigate to information points and use the below information to create one.
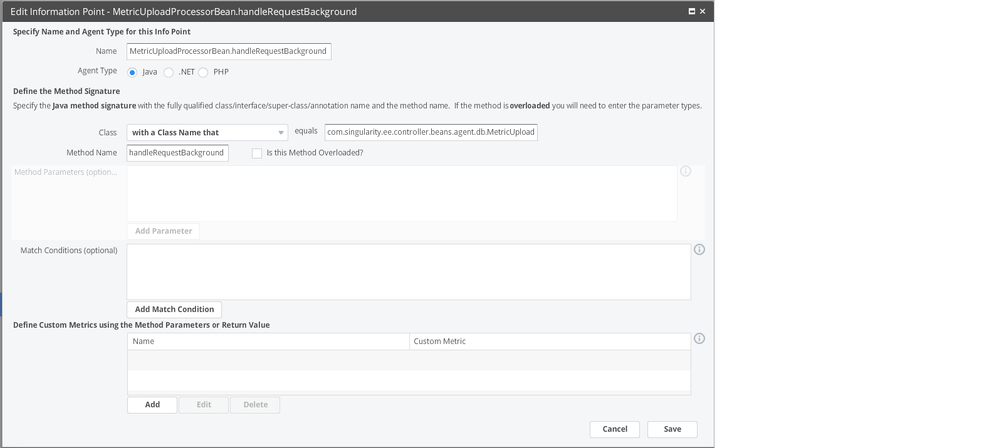
- Name: MetricUploadProcessorBean.handleRequestBackground
-
- Classname: com.singularity.ee.controller.beans.agent.db.MetricUploadProcessorBean
-
- Method Name: handleRequestBackground
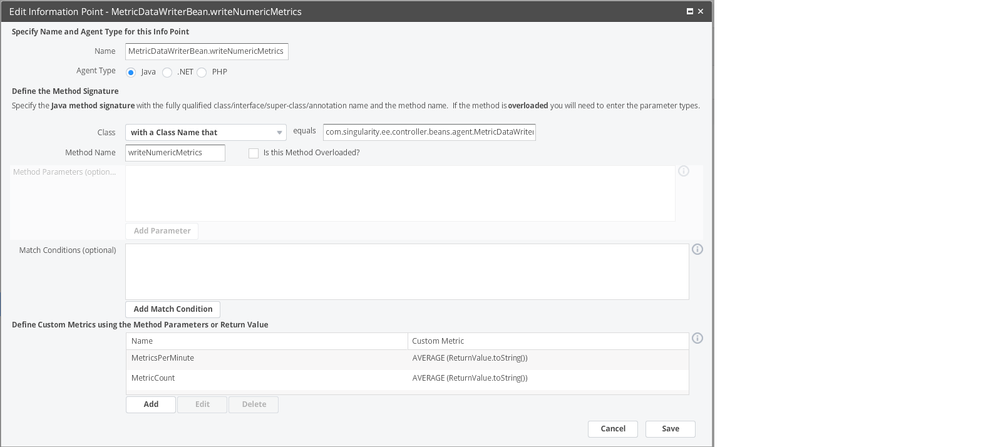
- Name: MetricDataWriterBean.writeNumericMetrics
- Classname: com.singularity.ee.controller.beans.agent.MetricDataWriterBean
-
- Method Name: writeNumericMetrics
- Information Point Custom Metric Definition:
-
- Name: MetricsPerMinute, Collect Data From: Return Value
- Name: MetricCount, Collect Data From: Return Value
Thanks,
Yogesh
- Mark as New
- Bookmark
- Subscribe
- Mute
- Subscribe to RSS Feed
- Permalink
- Report Inappropriate Content
01-30-2018 01:10 AM
Hi Yogesh,
Thanks for getting back to me.
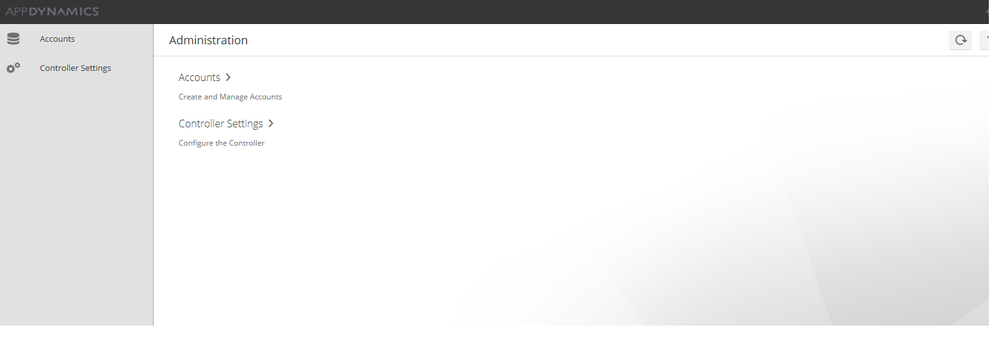
I have just had a look at the "/controller/admin.jsp" page but I do not seem to have the option to do what you have advised - please see the attached screenshot.
There are only two areas I can navigate to whilst on this page - Accounts and Contoller Settings. Within the controller setting I cannot add any new entry, I am currently running AppDynamics Version 4.2.12.2, build 24.
thanks
Moses
- Mark as New
- Bookmark
- Subscribe
- Mute
- Subscribe to RSS Feed
- Permalink
- Report Inappropriate Content
01-30-2018 01:16 AM
Hi Moses,
Please try below steps to login into internal agent.
1. Logout of the controller if already logged in from browser.
2. Hit the below URL and login to the controller.
<Host>:<Port>/controller/?enableAccounts=true
Account: system
User : root
password: <root password>
Once you login, please follow earlier suggested steps and let us know if you face any issues regarding this.
Thanks,
Yogesh
- Mark as New
- Bookmark
- Subscribe
- Mute
- Subscribe to RSS Feed
- Permalink
- Report Inappropriate Content
01-30-2018 06:29 AM
Hi Yogesh,
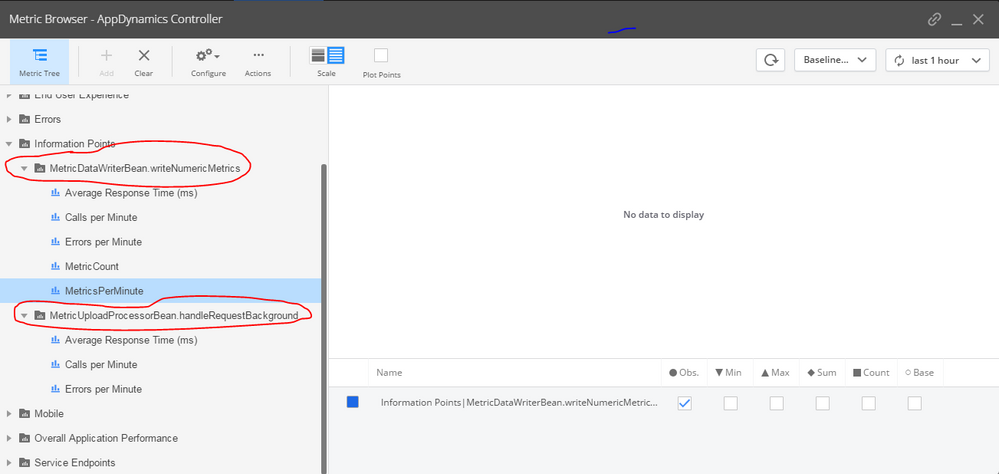
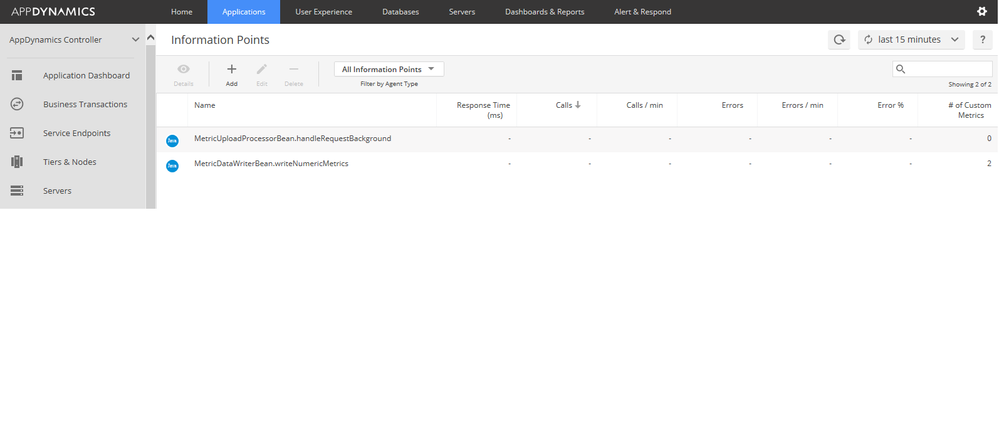
I have created the two Information points however these do not seem to be gathering any data. Waited for approx 1 hour but nothing if forthcoming. see the attachment below.
thanks
Moses
- Mark as New
- Bookmark
- Subscribe
- Mute
- Subscribe to RSS Feed
- Permalink
- Report Inappropriate Content
02-09-2018 02:36 AM
Hi Moses,
Can you please share screenshot of the configuration which you did on controller to verify?
Thanks,
Yogesh
- Mark as New
- Bookmark
- Subscribe
- Mute
- Subscribe to RSS Feed
- Permalink
- Report Inappropriate Content
02-13-2018 08:56 AM
Hi Yogesh,
Please see the attached screenshots as requested.
Kind regards
Moses
- Mark as New
- Bookmark
- Subscribe
- Mute
- Subscribe to RSS Feed
- Permalink
- Report Inappropriate Content
05-05-2020 05:13 AM - last edited on 05-05-2020 09:17 AM by Ryan.Paredez
Hi thank you for this,
Can you provide the proper Class and Method for controller: 20.4.0-3646
also correct the annotation on the paste of the IP information.
Thanks in advance
:-)Ole
- Mark as New
- Bookmark
- Subscribe
- Mute
- Subscribe to RSS Feed
- Permalink
- Report Inappropriate Content
05-06-2020 04:53 PM
Hi @Anonymous,
For this issue, it's best if you reach out to your AppD account rep for further. If you do learning anything valuable from that outcome, please do share it back on this post for creating a knowledge bank of answers for the community.
Thanks,
Ryan, Cisco AppDynamics Community Manager
Found something helpful? Click the Accept as Solution button to help others find answers faster.
Liked something? Click the Thumbs Up button.
Check out Observabiity in Action
new deep dive videos weekly in the Knowledge Base.
Join us on Feb 26 to explore Splunk AppDynamics deployment strategies, SaaS models, agent rollout plans, and expert best practices.
Register Now
Dive into our Community Blog for the Latest Insights and Updates!
Read the blog here
- Misatched counts in metric browser in Java (Java Agent, Installation, JVM, and Controller Installation)
- Percentage of calls with errors and hig response time. in General Discussions
- Common agent error in logs: Connection back off limitation in effect in General Discussions
- Not able to import health rule using API in Controller (SaaS, On Premises)
- Overall Application Performance Calls Per Minute in Controller (SaaS, On Premises)

Thank you! Your submission has been received!
Thank you! Your submission has been received!
Oops! Something went wrong while submitting the form
