- Community Hub
- Forum Q&A
- Business iQ (Analytics)
- Controller (SaaS, On Premise)
- Dashboards
- Dynamic Languages (Node.JS, Python, PHP, C/C++, Webserver Agent)
- End User Monitoring (EUM)
- Infrastructure (Server, Network, Database)
- Java (Java Agent, Installation, JVM, and Controller Installation)
- Licensing (including Trial)
- .NET (Agent, Installation)
- Smart Agent
- General Discussions
- Resources
- Groups
- Idea Exchange
Not a customer? Click the 'Start a free trial' link to begin a 30-day SaaS trial of our product and to join our community.
Existing Cisco AppDynamics customers should click the 'Sign In' button to authenticate to access the community
- Cisco AppDynamics Community
- Forums Q&A
- Infrastructure
- Sum of memory usage in processes is misleading.
- Subscribe to RSS Feed
- Mark Topic as New
- Mark Topic as Read
- Float this Topic for Current User
- Bookmark
- Subscribe
- Mute
- Printer Friendly Page
- Mark as New
- Bookmark
- Subscribe
- Mute
- Subscribe to RSS Feed
- Permalink
- Report Inappropriate Content
04-17-2024 01:48 PM
Hi everybody,
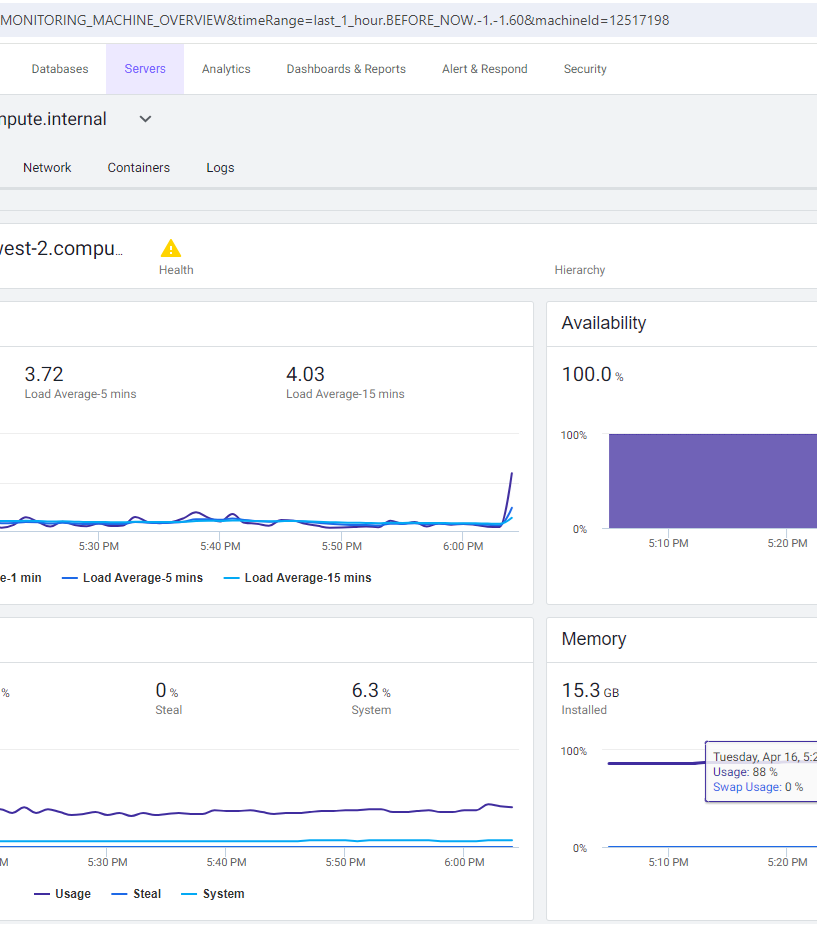
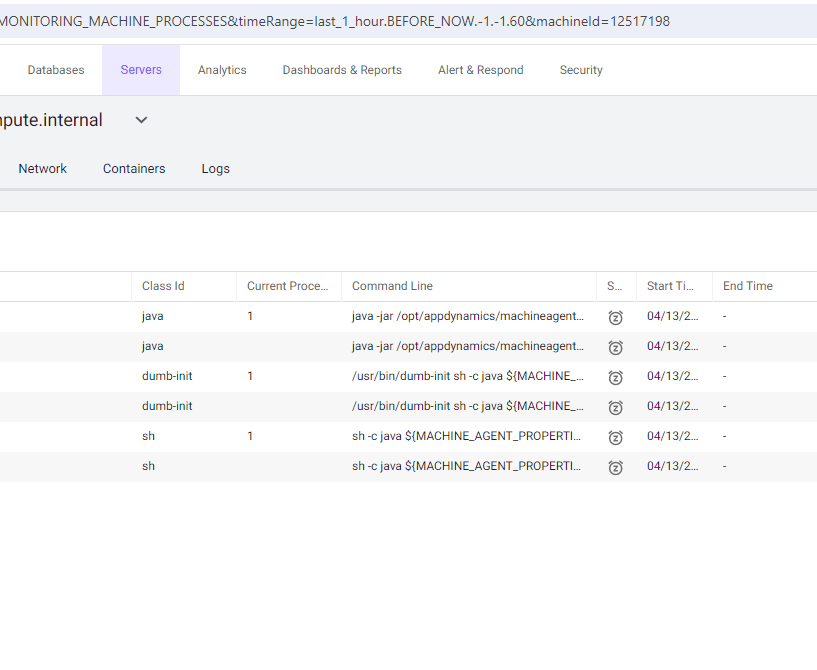
I was doing an internal demo presentation with the demo1, and someone noticed that in a server the memory usage was high (87.8%), when we checked the processes that were running, there was no process consuming memory, except 3% of the machine agent, so we don't understand why is showing that 87.8% peak.

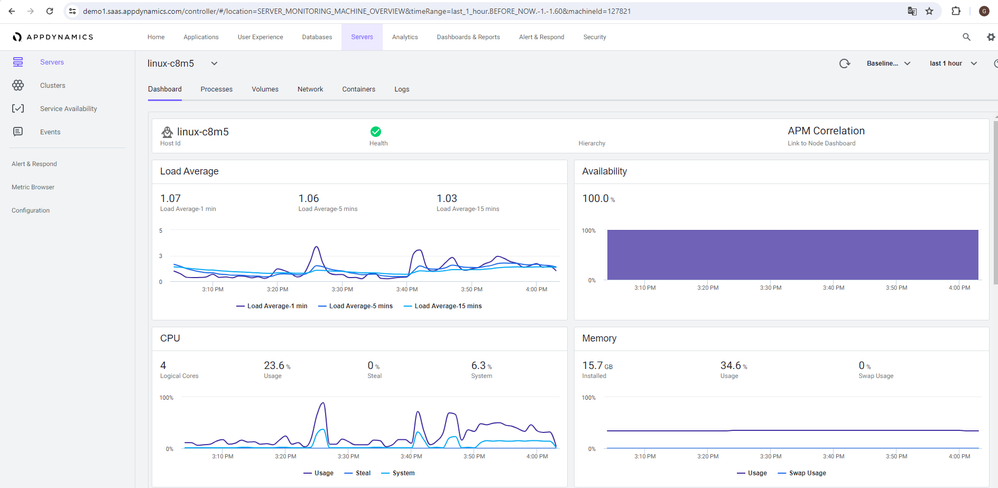
In other example happens the opposite, the memory usage in the server is 34.6%.

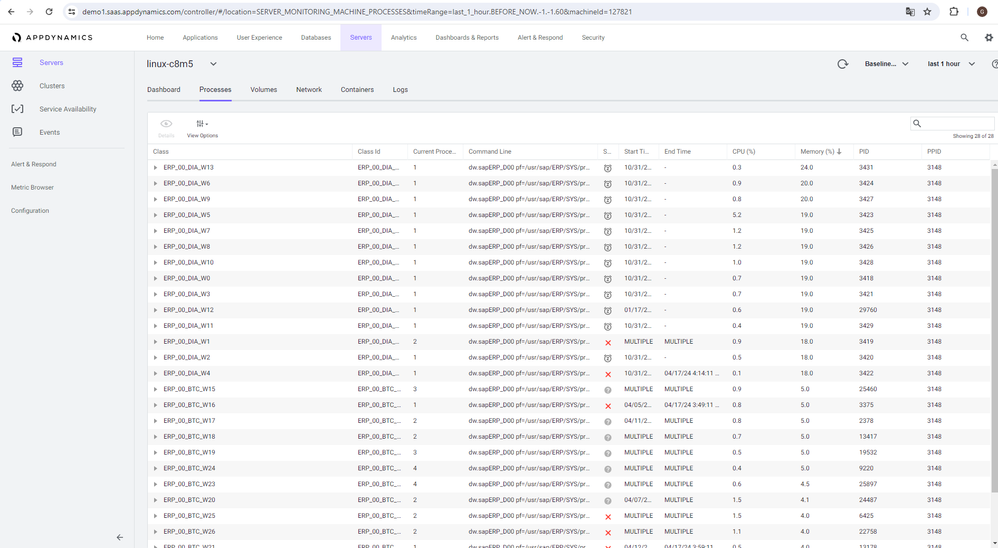
but the sum of the processes is way more than 100% 
Is this an interpretation problem of us or just an issue of the demo1? In other demos the sum is correct according to each process.
Thanks in advance.
Hope you're having a great day.
Solved! Go to Solution.
- Mark as New
- Bookmark
- Subscribe
- Mute
- Subscribe to RSS Feed
- Permalink
- Report Inappropriate Content
04-17-2024 03:03 PM
Hi @Gustavo.Marconi,
I reached out to a few people and Anderson B. should be getting in touch with you about this.
Thanks,
Ryan, Cisco AppDynamics Community Manager
Found something helpful? Click the Accept as Solution button to help others find answers faster.
Liked something? Click the Thumbs Up button.
Check out Observabiity in Action
new deep dive videos weekly in the Knowledge Base.
- Mark as New
- Bookmark
- Subscribe
- Mute
- Subscribe to RSS Feed
- Permalink
- Report Inappropriate Content
04-17-2024 04:31 PM
Hi Gustavo,
Excellent question and I can appreciate the interest in the discrepancies.
With demo systems, we're generally not dealing with live data. The way it's generated can vary and, at times, can cause abnormalities within the context of the data. This is what is going on here. Beyond this, in production, it's advisable to ensure your looking at the most specific time range possible to reduce the likelihood of data aggregation complexities. e.g. looking at 24 hour data is less effective than looking at 5 minute aggregation levels. The following two links may be beneficial too.
Server Visibility: https://docs.appdynamics.com/appd/24.x/24.4/en/infrastructure-visibility/server-visibility
Troubleshooting Applications: https://docs.appdynamics.com/appd/24.x/24.4/en/application-monitoring/troubleshooting-applications
- Mark as New
- Bookmark
- Subscribe
- Mute
- Subscribe to RSS Feed
- Permalink
- Report Inappropriate Content
04-18-2024 06:25 AM
Hi @Ryan.Paredez and @Troy.Partain ,
Thank you for the reply, that clarifies the issue for me, I'll be more careful with my demo presentations in the future, especially with potential customers.
Hope you both have a great day!
Learn how Splunk and AppDynamics are redefining observability
Register Now!
Dive into our Community Blog for the Latest Insights and Updates!
Read the blog here
- Does AppDynamics Machine Agent support windows 10? in Java (Java Agent, Installation, JVM, and Controller Installation)
- Controller only gets part of the data from machine agent, most metrics are missing in Infrastructure (Server, Network, Database)
- Process memory usage in NET (Agent, Installation)
- Memory utilization on Service level in Controller (SaaS, On Premises)
| User | Count |
|---|---|
| 2 | |
| 1 | |
| 1 | |
| 1 | |
| 1 | |
| 1 |

Thank you! Your submission has been received!
Thank you! Your submission has been received!
Oops! Something went wrong while submitting the form