- Community Hub
- Forum Q&A
- Business iQ (Analytics)
- Controller (SaaS, On Premise)
- Dashboards
- Dynamic Languages (Node.JS, Python, PHP, C/C++, Webserver Agent)
- End User Monitoring (EUM)
- Infrastructure (Server, Network, Database)
- Java (Java Agent, Installation, JVM, and Controller Installation)
- Licensing (including Trial)
- .NET (Agent, Installation)
- Smart Agent
- General Discussions
- Resources
- Groups
- Idea Exchange
Not a customer? Click the 'Start a free trial' link to begin a 30-day SaaS trial of our product and to join our community.
Existing Cisco AppDynamics customers should click the 'Sign In' button to authenticate to access the community
- Cisco AppDynamics Community
- Forums Q&A
- Infrastructure
- WebLogic Managed Server Health Status
- Subscribe to RSS Feed
- Mark Topic as New
- Mark Topic as Read
- Float this Topic for Current User
- Bookmark
- Subscribe
- Mute
- Printer Friendly Page
WebLogic Managed Server Health Status
- Mark as New
- Bookmark
- Subscribe
- Mute
- Subscribe to RSS Feed
- Permalink
- Report Inappropriate Content
07-09-2020 05:23 AM - last edited on 07-09-2020 09:35 AM by Ryan.Paredez
Hi Team,
I was trying to set an alert from Appdynamics for WebLogic Managed Server Nodes.
The requirement is that the alert must be sent if any of the managed server nodes of WebLogic is in warning, failed, or shutdown state. However, I could not find any option to set it. Can you please confirm if any such option is there in Appdynamics?
Regards,
Mohini Upasani
- Mark as New
- Bookmark
- Subscribe
- Mute
- Subscribe to RSS Feed
- Permalink
- Report Inappropriate Content
07-10-2020 12:41 AM
Hi There
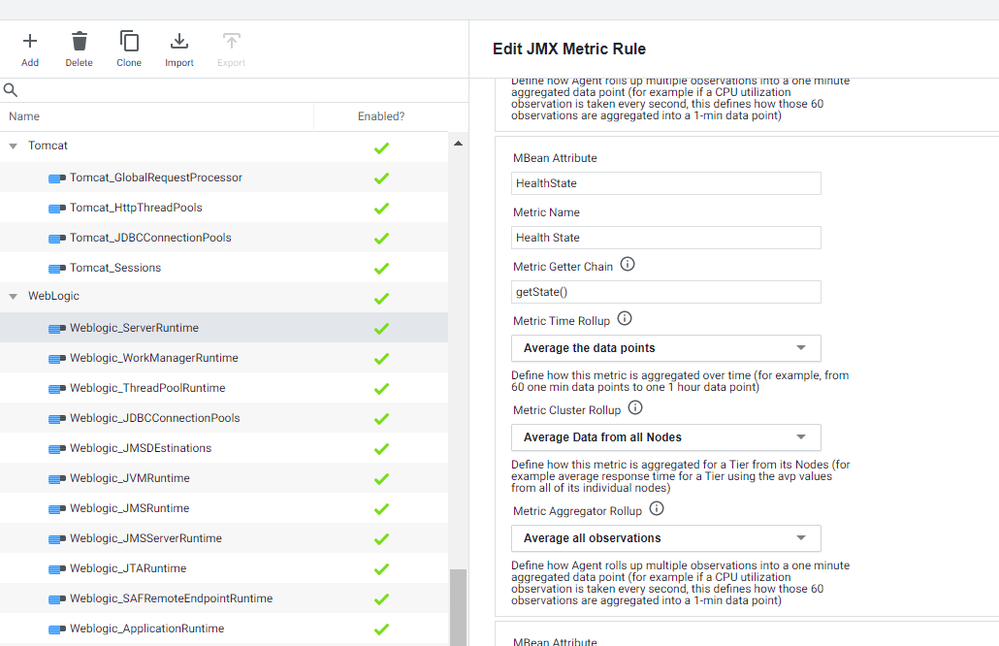
You can get the Health status through JMX configuration
I have attached config from our configuration, it falls under the JMX section called
Weblogic_ServerRuntime
The getter chain is getState()
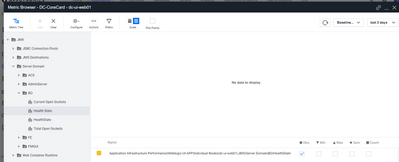
You can add this additional config to get the health status and view it via the Metric browser
It will show either 1 or 0, for healthy or not
You can then use this metric to build a health rule on
- Mark as New
- Bookmark
- Subscribe
- Mute
- Subscribe to RSS Feed
- Permalink
- Report Inappropriate Content
11-14-2022 01:35 AM - last edited on 11-14-2022 09:23 AM by Ryan.Paredez
hello, any update now,
I created the metric but cannot see any value.
- Mark as New
- Bookmark
- Subscribe
- Mute
- Subscribe to RSS Feed
- Permalink
- Report Inappropriate Content
11-14-2022 09:24 AM
Just confirming you followed @Mario.Morelli instructions and are not seeing any values?
Thanks,
Ryan, Cisco AppDynamics Community Manager
Found something helpful? Click the Accept as Solution button to help others find answers faster.
Liked something? Click the Thumbs Up button.
Check out Observabiity in Action
new deep dive videos weekly in the Knowledge Base.
Join us on Feb 26 to explore Splunk AppDynamics deployment strategies, SaaS models, agent rollout plans, and expert best practices.
Register Now
Dive into our Community Blog for the Latest Insights and Updates!
Read the blog here
- APM Agent won't load in WebLogic 14.1 in Java (Java Agent, Installation, JVM, and Controller Installation)
- Are there user management logs I can use to determine duplicated users, sign-up process status, last login-in date and activity? in Controller (SaaS, On Premises)
- Java Agent 4.5 compatibility with Weblogic 12.2.1.3.0 in Java (Java Agent, Installation, JVM, and Controller Installation)
- How can I create custom jmx metrics for weblogic in Dashboards

Thank you! Your submission has been received!
Thank you! Your submission has been received!
Oops! Something went wrong while submitting the form

