- Community Hub
- Forum Q&A
- Business iQ (Analytics)
- Controller (SaaS, On Premise)
- Dashboards
- Dynamic Languages (Node.JS, Python, PHP, C/C++, Webserver Agent)
- End User Monitoring (EUM)
- Infrastructure (Server, Network, Database)
- Java (Java Agent, Installation, JVM, and Controller Installation)
- Licensing (including Trial)
- .NET (Agent, Installation)
- Smart Agent
- General Discussions
- Resources
- Groups
- Idea Exchange
Not a customer? Click the 'Start a free trial' link to begin a 30-day SaaS trial of our product and to join our community.
Existing Cisco AppDynamics customers should click the 'Sign In' button to authenticate to access the community
- Cisco AppDynamics Community
- Forums Q&A
- Infrastructure
- Re: CPU Percentage Process Level (not Class level)
- Subscribe to RSS Feed
- Mark Topic as New
- Mark Topic as Read
- Float this Topic for Current User
- Bookmark
- Subscribe
- Mute
- Printer Friendly Page
CPU Percentage Process Level (not Class level)
- Mark as New
- Bookmark
- Subscribe
- Mute
- Subscribe to RSS Feed
- Permalink
- Report Inappropriate Content
09-06-2018 07:35 AM
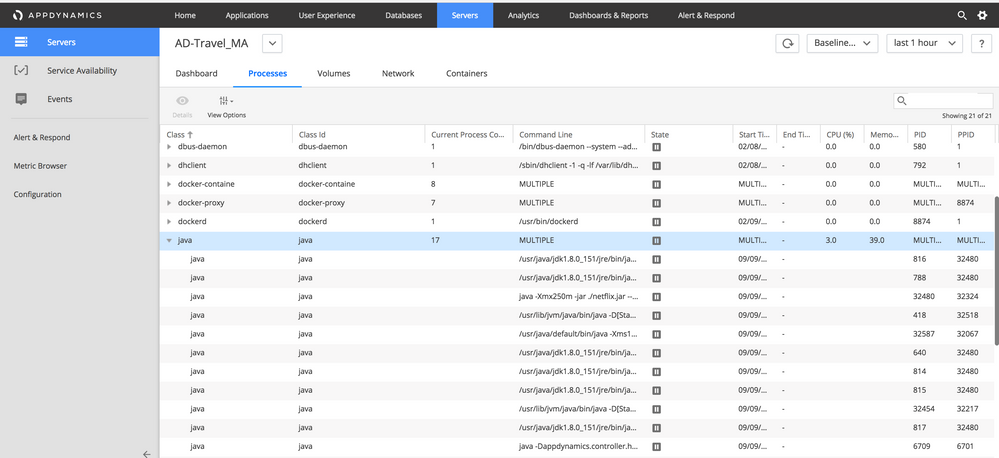
The CPU percentage on the Process View shows only cpu percentage grouped-by class. How can I get CPU percentage at specific individual process level please?
- CPU (%): The percentage of CPU resources by all process in this class.
- Mark as New
- Bookmark
- Subscribe
- Mute
- Subscribe to RSS Feed
- Permalink
- Report Inappropriate Content
09-13-2018 08:59 PM
Hi,
We understood you are referring to view below in UI and if above is the case and if you are looking for each process level using machien agent SIM feature, we see using SIM we get class level instead each process as of now, We suggest to see if using extension below helps?
https://www.appdynamics.com/community/exchange/extension/process-monitoring-extension/
that is see if customising below setting in config.yml under monitor config helps here?
# regex/pid/pidFile - process is fetched using this field
instances:
- Mark as New
- Bookmark
- Subscribe
- Mute
- Subscribe to RSS Feed
- Permalink
- Report Inappropriate Content
03-21-2019 04:46 PM
Are there any plans to include process level monitoring in SIM, without the need for the process monitoring extension? The benefit of having this information in the Processes view is being able to easily compare usage to other processes, which might be in the same class (i.e. java). This is harder to display using the Metric browser, which is what the extension would require users to use.
- Mark as New
- Bookmark
- Subscribe
- Mute
- Subscribe to RSS Feed
- Permalink
- Report Inappropriate Content
03-21-2019 11:45 PM
Hi Jeremy,
We confirm we already have a feature request in road map as of now no ETA yet on this.
Learn how Splunk and AppDynamics are redefining observability
Watch Now!
Dive into our Community Blog for the Latest Insights and Updates!
Read the blog here
- Events service shows critical after fresh installation in Controller (SaaS, On Premises)
- Class and Methold level monitoring in Java (Java Agent, Installation, JVM, and Controller Installation)
- Boolean cannot be cast to class String in Java (Java Agent, Installation, JVM, and Controller Installation)
- URL Monitoring Extension Crashing intermittently in Infrastructure (Server, Network, Database)
- Nodejs Agent 20.4.0 Mongodb error. in Dynamic Languages (Node.JS, Python, PHP, C/C++, Webserver Agent)

Thank you! Your submission has been received!
Thank you! Your submission has been received!
Oops! Something went wrong while submitting the form
