- Community Hub
- Forum Q&A
- Business iQ (Analytics)
- Controller (SaaS, On Premise)
- Dashboards
- Dynamic Languages (Node.JS, Python, PHP, C/C++, Webserver Agent)
- End User Monitoring (EUM)
- Infrastructure (Server, Network, Database)
- Java (Java Agent, Installation, JVM, and Controller Installation)
- Licensing (including Trial)
- .NET (Agent, Installation)
- Smart Agent
- General Discussions
- Resources
- Groups
- Idea Exchange
Not a customer? Click the 'Start a free trial' link to begin a 30-day SaaS trial of our product and to join our community.
Existing Cisco AppDynamics customers should click the 'Sign In' button to authenticate to access the community
- Cisco AppDynamics Community
- Forums Q&A
- Dynamic Languages
- Re: How nodejs cluster metrics are calculated in A...
- Subscribe to RSS Feed
- Mark Topic as New
- Mark Topic as Read
- Float this Topic for Current User
- Bookmark
- Subscribe
- Mute
- Printer Friendly Page
How nodejs cluster metrics are calculated in APPDYNAMICS?
- Mark as New
- Bookmark
- Subscribe
- Mute
- Subscribe to RSS Feed
- Permalink
- Report Inappropriate Content
01-21-2018 11:11 PM
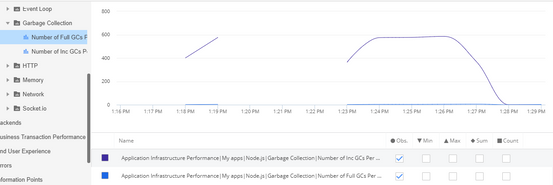
I'm using NODEJS cluster (1 master and 4 worker threads) totally 5 processes are running on my machine. But in the metric browser page, It is showing only single GC metrics?
what about others?
How cpu, GC, eventloop, memory metrics are all calculated for the nodejs cluster environment?
Is there any document available for this?
- Mark as New
- Bookmark
- Subscribe
- Mute
- Subscribe to RSS Feed
- Permalink
- Report Inappropriate Content
01-21-2018 11:35 PM - edited 01-21-2018 11:36 PM
Hi Devraj,
Do you see 5 nodes in the Tiers and Node Tab in the application or just one node ?
Are you on SAAS, or ON-PREM ? If SAAS, please share the URL when the metric browser is open with this metric.
Thanks
Ayush
- Mark as New
- Bookmark
- Subscribe
- Mute
- Subscribe to RSS Feed
- Permalink
- Report Inappropriate Content
01-21-2018 11:58 PM
Do you see 5 nodes in the Tiers and Node Tab in the application or just one node?
Yes I can able to see the 5 nodes in the Tiers page (I downed one.)
Are you on SAAS, or ON-PREM ?
I'm using SAAS
If SAAS, please share the URL when the metric browser is open with this metric.
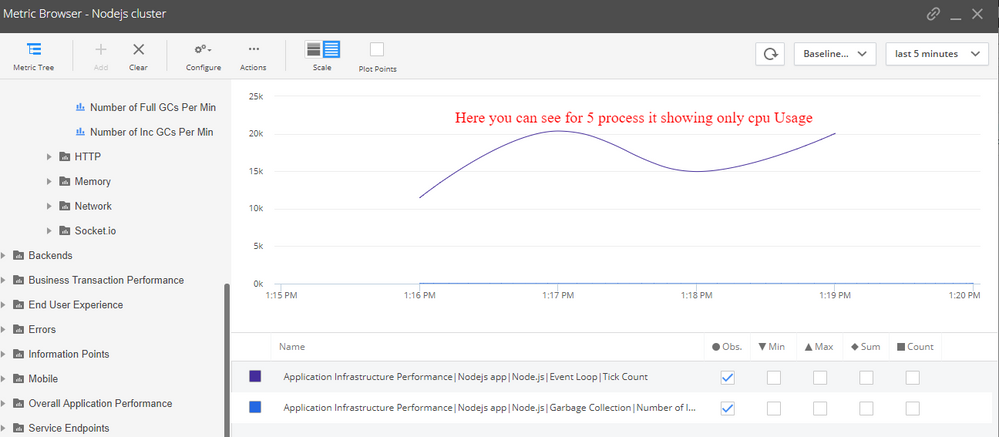
Please find the attached image.
My question is where I can see the cpu usage for the 5 nodejs processes?
- Mark as New
- Bookmark
- Subscribe
- Mute
- Subscribe to RSS Feed
- Permalink
- Report Inappropriate Content
01-22-2018 12:06 AM - last edited on 04-28-2022 02:23 PM by Ryan.Paredez
^ Post edited by @Ryan.Paredez
[Controller URL redacted]
Please do not share links to your Controller on the Community for Privacy and Security reasons. If you do need toshare this, please do it via a private message within the Community platform.
- Mark as New
- Bookmark
- Subscribe
- Mute
- Subscribe to RSS Feed
- Permalink
- Report Inappropriate Content
01-22-2018 02:18 AM - last edited on 04-28-2022 02:27 PM by Ryan.Paredez
Hi Devaraj,
Please have a look at this link.
[Redacted]
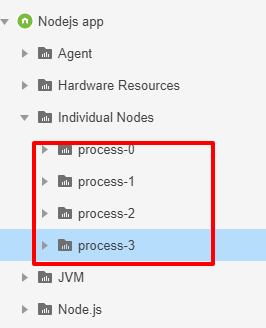
There are Metrics of GC for each node, and the aggregate GC for all Node.Js in the link above.
The screenshot if the GC you showed earlier was from the aggregate one. You can drill down to individual nodes to view the specific GC and other details.
Please let us know if you have more queries.
Thanks
Ayush
^ Post edited by @Ryan.Paredez - Please do not share links to your Controller on the Community for Privacy and Security reasons. If you do need to share this, please do it via a private message within the Community platform.
- Mark as New
- Bookmark
- Subscribe
- Mute
- Subscribe to RSS Feed
- Permalink
- Report Inappropriate Content
01-22-2018 02:33 AM
Thank you so much Ayush:)
- Mark as New
- Bookmark
- Subscribe
- Mute
- Subscribe to RSS Feed
- Permalink
- Report Inappropriate Content
01-22-2018 03:07 AM - edited 01-22-2018 03:09 AM
Hi ,
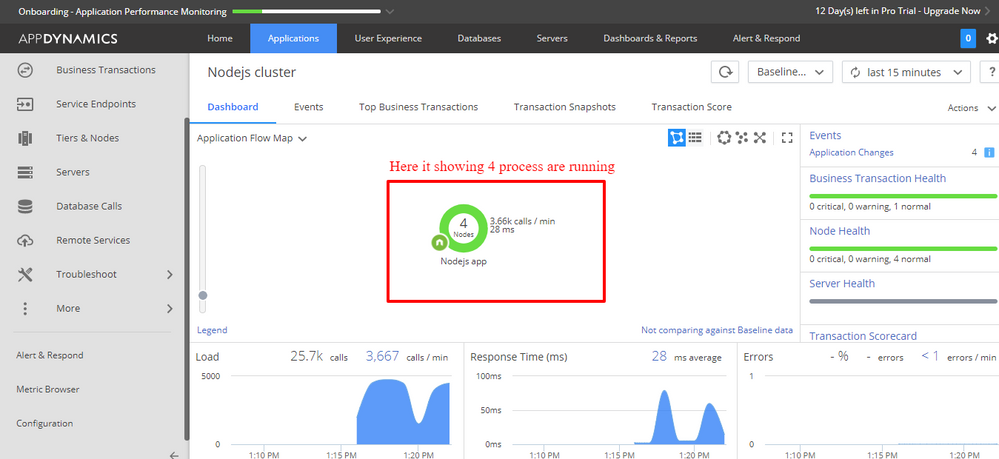
I'm running totally 1 master and 4 worker threads but here it's showing only 4 processes.
Where is the master process?
But in tier page it showing 5 process, Is master process is skipped?
Join us on Feb 26 to explore Splunk AppDynamics deployment strategies, SaaS models, agent rollout plans, and expert best practices.
Register Now
Dive into our Community Blog for the Latest Insights and Updates!
Read the blog here
- import/export custom db metrics in Dashboards
- Integrating CloudWatch Metrics to AppDynamics in Controller (SaaS, On Premises)
- Can AppDynamics monitor Salesforce application? in Controller (SaaS, On Premises)
- Help needed with setting Up EUM Browser metrics dashboard in AppDynamics in Dashboards
- How to divide session? in End User Monitoring (EUM)

Thank you! Your submission has been received!
Thank you! Your submission has been received!
Oops! Something went wrong while submitting the form


