- Community Hub
- Forum Q&A
- Business iQ (Analytics)
- Controller (SaaS, On Premise)
- Dashboards
- Dynamic Languages (Node.JS, Python, PHP, C/C++, Webserver Agent)
- End User Monitoring (EUM)
- Infrastructure (Server, Network, Database)
- Java (Java Agent, Installation, JVM, and Controller Installation)
- Licensing (including Trial)
- .NET (Agent, Installation)
- Smart Agent
- General Discussions
- Resources
- Groups
- Idea Exchange
Not a customer? Click the 'Start a free trial' link to begin a 30-day SaaS trial of our product and to join our community.
Existing Cisco AppDynamics customers should click the 'Sign In' button to authenticate to access the community
- Cisco AppDynamics Community
- Forums Q&A
- Dashboards
- Re: custom metrix
- Subscribe to RSS Feed
- Mark Topic as New
- Mark Topic as Read
- Float this Topic for Current User
- Bookmark
- Subscribe
- Mute
- Printer Friendly Page
- Mark as New
- Bookmark
- Subscribe
- Mute
- Subscribe to RSS Feed
- Permalink
- Report Inappropriate Content
04-03-2023 02:35 AM
Hi Team,
I am trying to load a custom metrics onto the dashboard & its not loading any data.
For individual applications when i try to get the Metrix data in dashboard i can see the data coming .
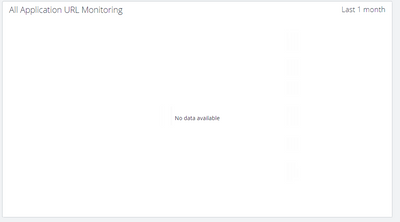
But when i tried to get all applications URL monitoring on a dashboard as i configured on a single server and when i try to get the data on dashboard I am unable to get the data ,Its showing data not available
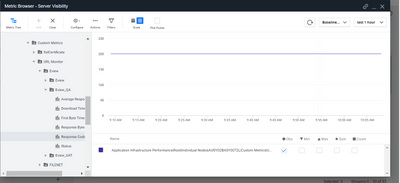
Individual applications on the server under Metrix Browser am able to get but all together on the dashboard am unable to see .
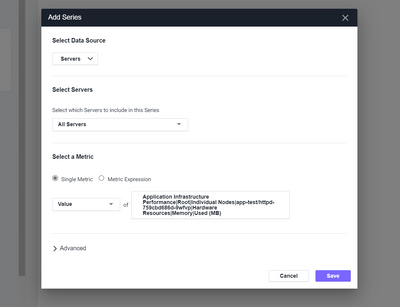
I have attached the screenshots.
Kindly suggest on how to get this fixed.
Regards,
Srujana .
Solved! Go to Solution.
- Mark as New
- Bookmark
- Subscribe
- Mute
- Subscribe to RSS Feed
- Permalink
- Report Inappropriate Content
04-03-2023 04:25 AM
Hi Srujana
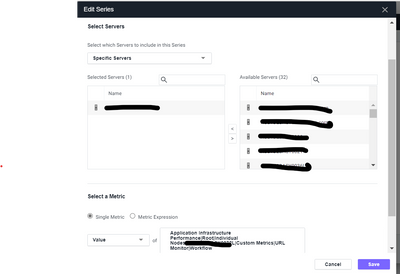
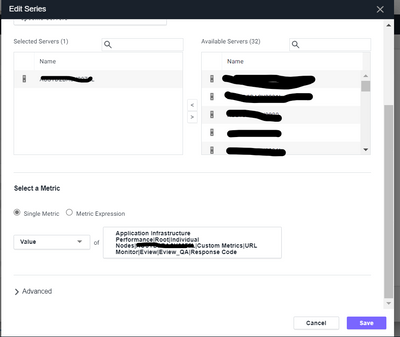
For the custom metrics for servers you need to remove the initial tree structure, as it's by default already included if you select Application infrastructure
Start where it says Custom Metrics, example below. Not sure of your full path
If you want to graph multiple values in one graph, use wildcard example
Custom Metrics|URL Monitor|*|value
Single server example
Custom Metrics|URL Monitor|server1.com|value
- Mark as New
- Bookmark
- Subscribe
- Mute
- Subscribe to RSS Feed
- Permalink
- Report Inappropriate Content
04-03-2023 09:44 PM - edited 04-03-2023 09:47 PM
Hi Morelli,
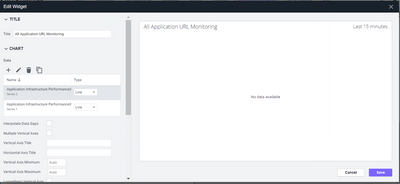
I have tried by giving each application also under custom metrix but still it says no data available when i configure on dashboard
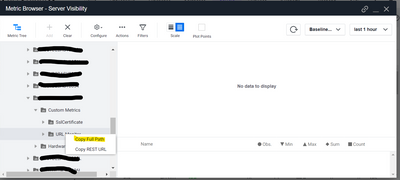
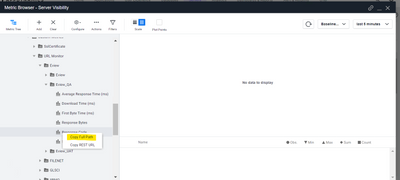
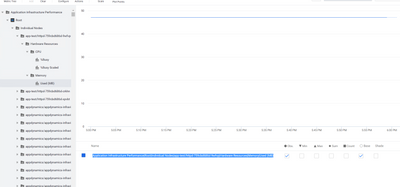
but whereas i can see them on Metrix browser-Server visibility.
Please find the screenshots below and can you please help me with the issue.
in dashboards no data is available :
In Metrix we can see the data is been triggered:
- Mark as New
- Bookmark
- Subscribe
- Mute
- Subscribe to RSS Feed
- Permalink
- Report Inappropriate Content
04-04-2023 01:25 AM
Hi Srujana
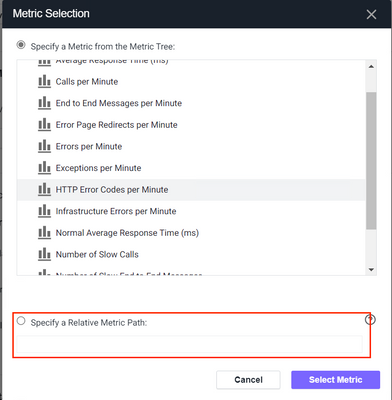
How are you configuring the path, are you selecting it manually or using the relative path where you copy the full path from the metric browser and paste it into the "specify relative path" section?
if you are using the relative path option, please remove all the characters before Custom metrics, the path should start with Custom Metrics|URL Monitor|xxxxxx
- Mark as New
- Bookmark
- Subscribe
- Mute
- Subscribe to RSS Feed
- Permalink
- Report Inappropriate Content
04-04-2023 04:41 AM
Hi Morelli,
Thankyou so much for the help.
The above solution worked .
Regards,
Srujana.
- Mark as New
- Bookmark
- Subscribe
- Mute
- Subscribe to RSS Feed
- Permalink
- Report Inappropriate Content
07-11-2023 03:05 AM
Hi Morelli,
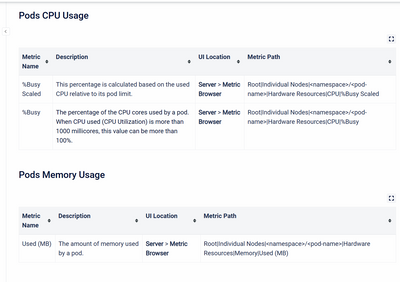
I need your expert suggestion, may I know how I can use the full path instead of the relative path, It seems I can only use the relative path here. I want to create my own dashboard to monitor Pods CPU Usage, Pods Memory Usage. It show data not available as I use the full path
Regards,
Louis.
Join us on Feb 26 to explore Splunk AppDynamics deployment strategies, SaaS models, agent rollout plans, and expert best practices.
Register Now
Dive into our Community Blog for the Latest Insights and Updates!
Read the blog here
- Help for configuring Health Rule schedule in General Discussions
- Error detection/suppression in APM in General Discussions
- Java Agent for WebMethods on Linux in Java (Java Agent, Installation, JVM, and Controller Installation)
- Restore deleted custom dashboard in End User Monitoring (EUM)
- Creating custom metrics for ADQL query for monitoring Intune connectors in Business iQ (Analytics)

Thank you! Your submission has been received!
Thank you! Your submission has been received!
Oops! Something went wrong while submitting the form
