- Community Hub
- Forum Q&A
- Business iQ (Analytics)
- Controller (SaaS, On Premise)
- Dashboards
- Dynamic Languages (Node.JS, Python, PHP, C/C++, Webserver Agent)
- End User Monitoring (EUM)
- Infrastructure (Server, Network, Database)
- Java (Java Agent, Installation, JVM, and Controller Installation)
- Licensing (including Trial)
- .NET (Agent, Installation)
- Smart Agent
- General Discussions
- Resources
- Groups
- Idea Exchange
Not a customer? Click the 'Start a free trial' link to begin a 30-day SaaS trial of our product and to join our community.
Existing Cisco AppDynamics customers should click the 'Sign In' button to authenticate to access the community
- Cisco AppDynamics Community
- Forums Q&A
- Dashboards
- Re: How to get DB top 10 query wait states in AppD...
- Subscribe to RSS Feed
- Mark Topic as New
- Mark Topic as Read
- Float this Topic for Current User
- Bookmark
- Subscribe
- Mute
- Printer Friendly Page
At 6pm PST, the AppDynamics Community will go into read-only mode and after migration is complete, you will be redirected to community.splunk.com.
Read more here
How to get DB top 10 query wait states in AppD dashboard.
- Mark as New
- Bookmark
- Subscribe
- Mute
- Subscribe to RSS Feed
- Permalink
- Report Inappropriate Content
11-09-2023 05:24 AM
- Mark as New
- Bookmark
- Subscribe
- Mute
- Subscribe to RSS Feed
- Permalink
- Report Inappropriate Content
11-11-2023 05:24 AM
Hi Ashok,
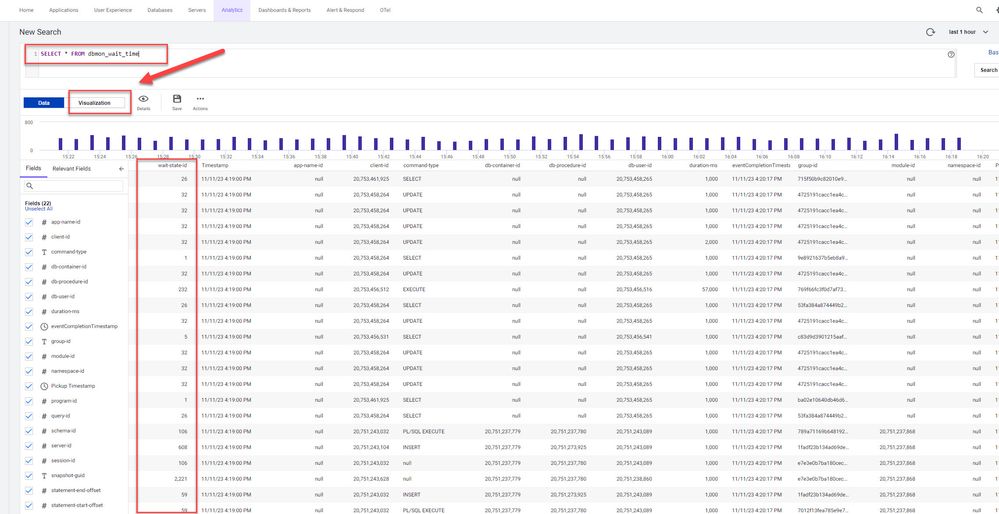
I you have Analytics you can use ADQL in order create Top 10 query wait states widget
Thanks
Cansel
- Mark as New
- Bookmark
- Subscribe
- Mute
- Subscribe to RSS Feed
- Permalink
- Report Inappropriate Content
04-15-2024 10:12 PM
@Cansel.OZCAN I have analytics, but it is still not showing. Can you please tell me the query for getting the top 10 sessions by weight widget?
- Mark as New
- Bookmark
- Subscribe
- Mute
- Subscribe to RSS Feed
- Permalink
- Report Inappropriate Content
04-16-2024 06:57 AM
Hi Hardik,
You can use this ADQL as a simple
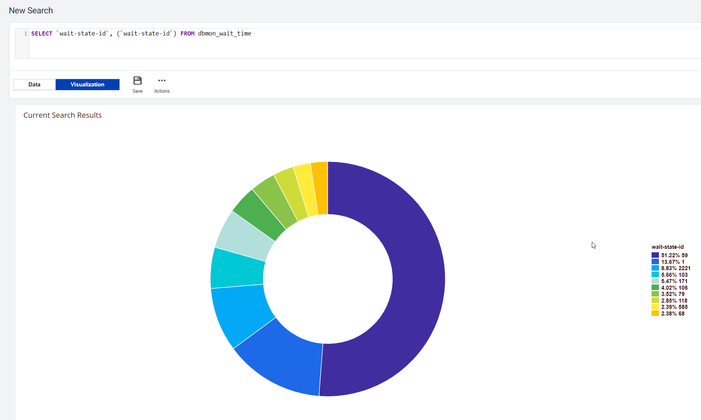
SELECT `wait-state-id`, (`wait-state-id`) FROM dbmon_wait_time
This query gathers data based on "wait state id" but you can change this query based on "wait state name"
For Example wait state id 59 = Using CPU
Thanks
Cansel
- Mark as New
- Bookmark
- Subscribe
- Mute
- Subscribe to RSS Feed
- Permalink
- Report Inappropriate Content
04-16-2024 09:48 PM
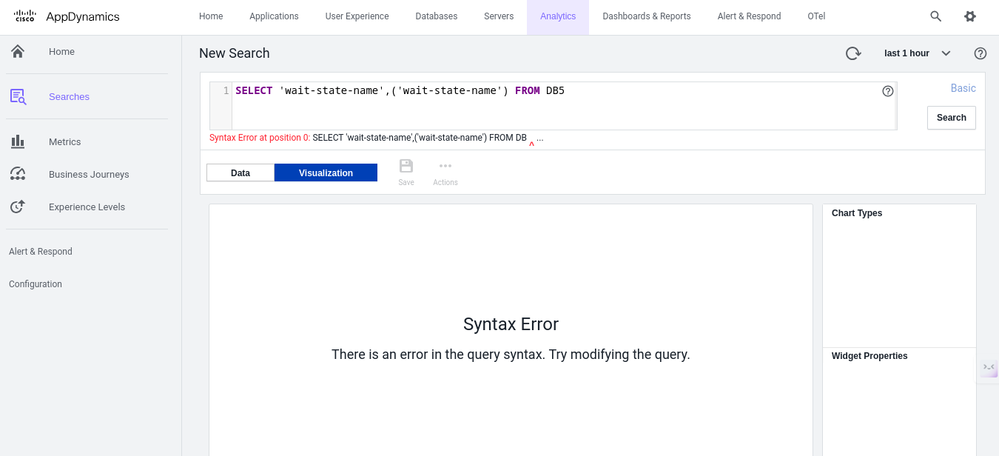
Hello Cansel,
I did the same, but it is showing me a syntax error. Please find the attachment below.
- Mark as New
- Bookmark
- Subscribe
- Mute
- Subscribe to RSS Feed
- Permalink
- Report Inappropriate Content
04-16-2024 11:53 PM
Hi Hardik,
Actually, this is not a syntax error, after "FROM" you specify the data source and there is no data source like "DB5". You have to use "dbmon_wait_time" this comes from event service shards.
Another thing is (sorry this is my fault
SELECT `wait-state-id`, count(`wait-state-id`) FROM dbmon_wait_time
Thanks
Cansel
- Mark as New
- Bookmark
- Subscribe
- Mute
- Subscribe to RSS Feed
- Permalink
- Report Inappropriate Content
04-17-2024 12:59 AM
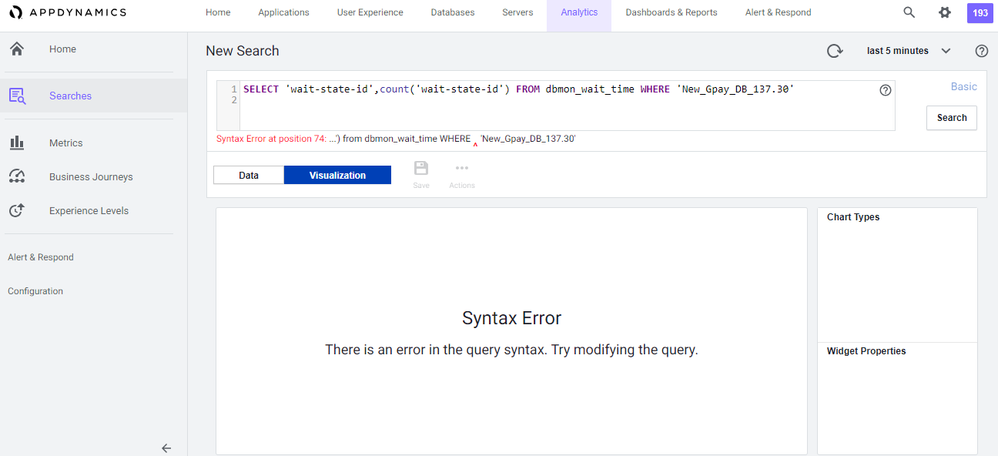
Dear Cansel,
The query you have shared is running properly on one collector, but what if there are multiple collectors? It is showing me the wait state with its numeric IDs and giving a count for it as well. Another thing was, can I show the name of query with it's ID? Please check if the query is right or wrong because it is still not showing. One more thing, I want to let you know my setup is on prem. Please find the attachment below
Thanks & Regards,
Hardik
- Mark as New
- Bookmark
- Subscribe
- Mute
- Subscribe to RSS Feed
- Permalink
- Report Inappropriate Content
04-18-2024 02:20 AM
Hi Hardik,
The query that i sent to you is working for the whole collectors (I have only 1 collector so it is showing only 1
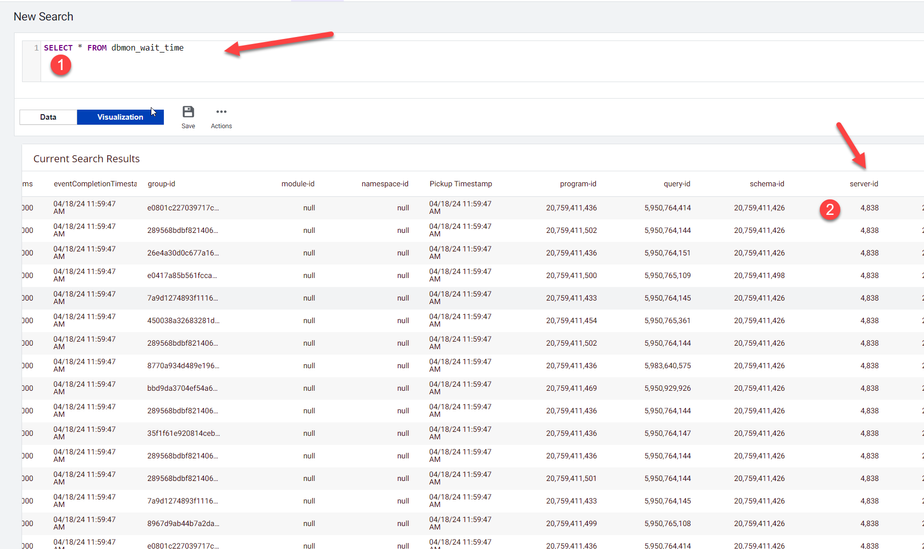
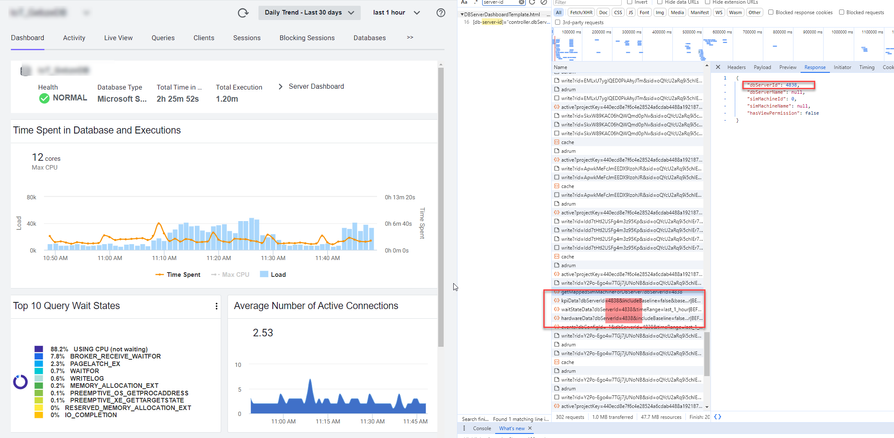
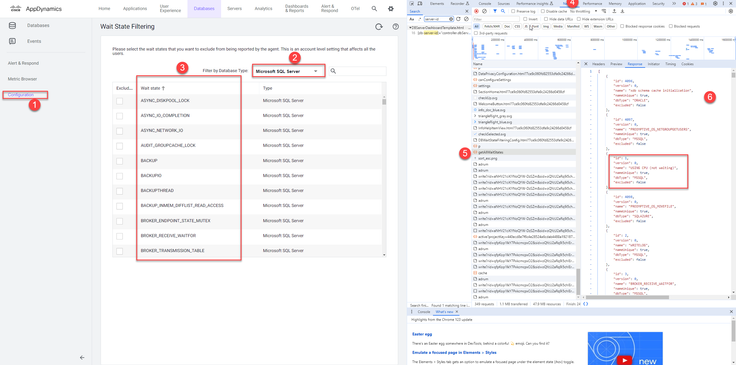
If you have more than 1 collector you need to add "WHERE" clause with "server-id" property in order to filter your exact collector match. (you can also find which server-id is equal to which collector name via Chrome 12 Network tools. I sent you a reference screenshot)
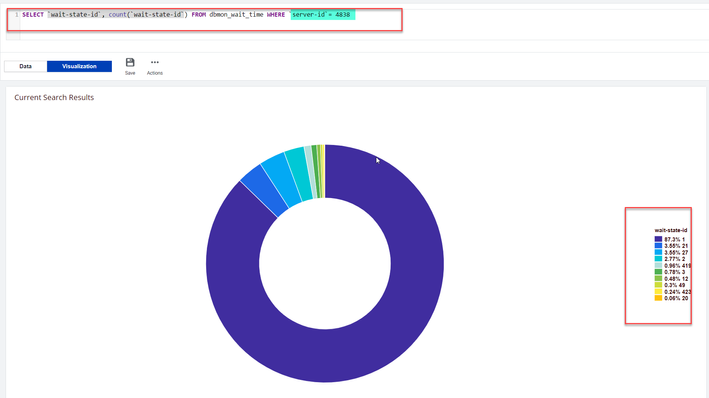
The query below will be useful for you to filter the exact collector,
In my example, I'm only working with a collector that server-id =4838
you can find your collector's server-id via Chrome-FireFox brows. developer tools like this below,
First Open you database collector via AppD controller UI below at the same time you can find the server-id detail over Browser's "Network-Response tab"
After finding the exact server-id property you can use this Select query below for the result
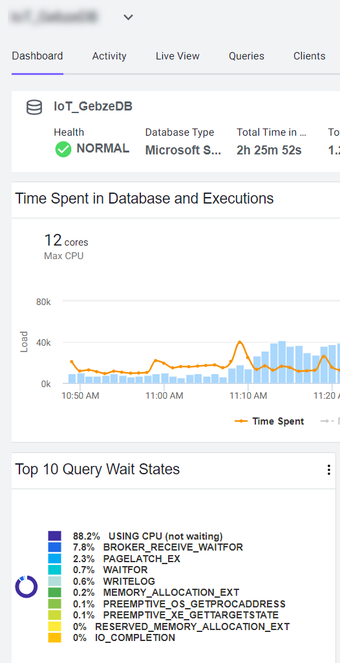
If you want to compare result via Default dashboard widget as you can see it is also same below,
Btw you can also find wait-stat-id explanation detail same way (over Chrome developer tool)
If you want more detail please feel free.
Thanks
Cansel
- Mark as New
- Bookmark
- Subscribe
- Mute
- Subscribe to RSS Feed
- Permalink
- Report Inappropriate Content
04-18-2024 09:57 PM
Thank you, @Cansel.OZCAN this information helped me alot.
Join us on Feb 26 to explore Splunk AppDynamics deployment strategies, SaaS models, agent rollout plans, and expert best practices.
Register Now
Dive into our Community Blog for the Latest Insights and Updates!
Read the blog here

Thank you! Your submission has been received!
Thank you! Your submission has been received!
Oops! Something went wrong while submitting the form
