- Community Hub
- Forum Q&A
- Business iQ (Analytics)
- Controller (SaaS, On Premise)
- Dashboards
- Dynamic Languages (Node.JS, Python, PHP, C/C++, Webserver Agent)
- End User Monitoring (EUM)
- Infrastructure (Server, Network, Database)
- Java (Java Agent, Installation, JVM, and Controller Installation)
- Licensing (including Trial)
- .NET (Agent, Installation)
- Smart Agent
- General Discussions
- Resources
- Groups
- Idea Exchange
Not a customer? Click the 'Start a free trial' link to begin a 30-day SaaS trial of our product and to join our community.
Existing Cisco AppDynamics customers should click the 'Sign In' button to authenticate to access the community
- Cisco AppDynamics Community
- Resources
- Knowledge Base
- Sample custom dashboard for Development teams
- Subscribe to RSS Feed
- Mark as New
- Mark as Read
- Bookmark
- Subscribe
- Printer Friendly Page
- Report Inappropriate Content
- Article History
- Subscribe to RSS Feed
- Mark as New
- Mark as Read
- Bookmark
- Subscribe
- Printer Friendly Page
- Report Inappropriate Content
on
06-21-2017
09:39 AM
- edited on
10-24-2019
09:43 PM
by
Claudia.Landiva
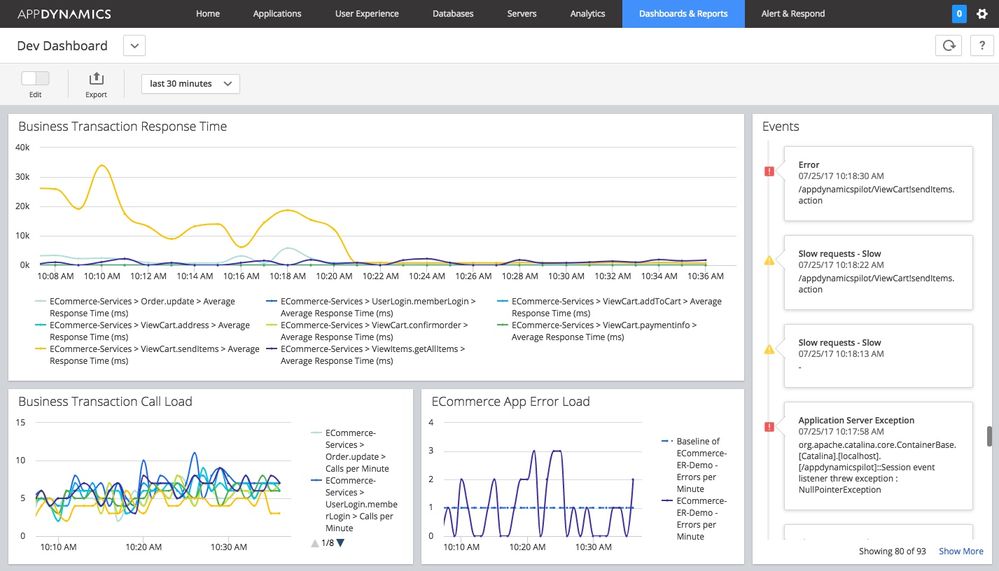
This sample dashboard is targeted primarily for Development teams, enabling them to track the performance status of their code broken down by Business Transactions.

To use this dashboard layout, import the attached JSON file and follow the instructions to rebind similar metrics in another application.
- Login to your Controller UI (3.9 and higher).
- Navigate to the Custom Dashboards list screen.
- Import the JSON file.
- Rebind the metrics which correspond to your particular application. To do this, you edit each displayed widget in the dashboard, select your application and then confirm or select the metric for that display.
If you need detailed instructions for working with custom dashboard widgets, please visit docs.appdynamics.com and view Create Custom Dashboards.
For more information on export/importing dashboards, please visit docs.appdynamics.com: Import and Export Custom Dashboards with the UI.
Want to learn more? Sign up for the "Custom Dashboards Best Practices and How-to Walkthroughs" self-paced course through AppDynamics University.
Return to Dashboard Dos and Don'ts.
- Mark as Read
- Mark as New
- Bookmark
- Permalink
- Report Inappropriate Content
In Dashboard & reports, I am configuring a custom widget. In this process some fields are not extracted, then I am trying to configure through Edit Source Rules at the left bottom in Fields tab. when I click on source rule I am getting the following error:
Extract Fields
HTTP Status 400 - Bad Request type Status report messageBad Request description request sent by the client was syntactically incorrect.
!<!DOCTYPE html PUBLIC "-//W3C//DTD XHTML 1.0 Strict//EN" "http://www.w3.org/TR/xhtml1/DTD/xhtml1-strict.dtd"><html xmlns="http://www.w3.org/1999/xhtml"><head><title>AppDynamics - Error report</title><style type="text/css"><!--H1 {font-family:Tahoma,Arial,sans-serif;color:white;background-color:#525D76;font-size:22px;} H2 {font-family:Tahoma,Arial,sans-serif;color:white;background-color:#525D76;font-size:16px;} H3 {font-family:Tahoma,Arial,sans-serif;color:white;background-color:#525D76;font-size:14px;} BODY {font-family:Tahoma,Arial,sans-serif;color:black;background-color:white;} B {font-family:Tahoma,Arial,sans-serif;color:white;background-color:#525D76;} P {font-family:Tahoma,Arial,sans-serif;background:white;color:black;font-size:12px;}A {color : black;}HR {color : #525D76;}--></style> </head><body><h1>HTTP Status 400 - Bad Request</h1><hr/><p><b>type</b> Status report</p><p><b>message</b>Bad Request</p><p><b>description</b>The request sent by the client was syntactically incorrect.</p><hr/><h3>AppDynamics</h3></body></html>
can you help me?
- Mark as Read
- Mark as New
- Bookmark
- Permalink
- Report Inappropriate Content
use this dashboard layout App
@Anonymous wrote:This sample dashboard is targeted primarily for Development teams, enabling them to track the performance status of their code broken down by Business Transactions.
Updated image and download 8-1-17
To use this dashboard layout, import the attached JSON file and follow the instructions to rebind similar metrics in another application.
- Login to your Controller UI (3.9 and higher).
- Navigate to the Custom Dashboards list screen.
- Import the JSON file.
- Rebind the metrics which correspond to your particular application. To do this, you edit each displayed widget in the dashboard, select your application and then confirm or select the metric for that display.
If you need detailed instructions for working with custom dashboard widgets, please visit docs.appdynamics.com and view Create Custom Dashboards.
For more information on export/importing dashboards, please visit docs.appdynamics.com: Import and Export Custom Dashboards with the UI.
Want to learn more? Sign up for the "Custom Dashboards Best Practices and How-to Walkthroughs" self-paced course through AppDynamics University.
Return to Dashboard Do's and Don'ts.
Learn how Splunk and AppDynamics are redefining observability
Watch Now!
Dive into our Community Blog for the Latest Insights and Updates!
Read the blog here

Thank you! Your submission has been received!
Thank you! Your submission has been received!
Oops! Something went wrong while submitting the form