- Community Hub
- Forum Q&A
- Business iQ (Analytics)
- Cisco Cloud Observability
- Controller (SaaS, On Premise)
- Dashboards
- Dynamic Languages (Node.JS, Python, PHP, C/C++, Webserver Agent)
- End User Monitoring (EUM)
- Infrastructure (Server, Network, Database)
- Java (Java Agent, Installation, JVM, and Controller Installation)
- Licensing (including Trial)
- .NET (Agent, Installation)
- Privacy and Security
- Smart Agent
- General Discussions
- Resources
- Groups
- Idea Exchange
Not a customer? Click the 'Start a free trial' link to begin a 30-day SaaS trial of our product and to join our community.
Existing Cisco AppDynamics customers should click the 'Sign In' button to authenticate to access the community
- Cisco AppDynamics Community
- Resources
- Knowledge Base
- Sample Custom Dashboard for Business Transaction R...
- Subscribe to RSS Feed
- Mark as New
- Mark as Read
- Bookmark
- Subscribe
- Printer Friendly Page
- Report Inappropriate Content
- Article History
- Subscribe to RSS Feed
- Mark as New
- Mark as Read
- Bookmark
- Subscribe
- Printer Friendly Page
- Report Inappropriate Content
on
04-13-2016
09:34 AM
- edited on
02-16-2021
09:25 PM
by
Claudia.Landiva
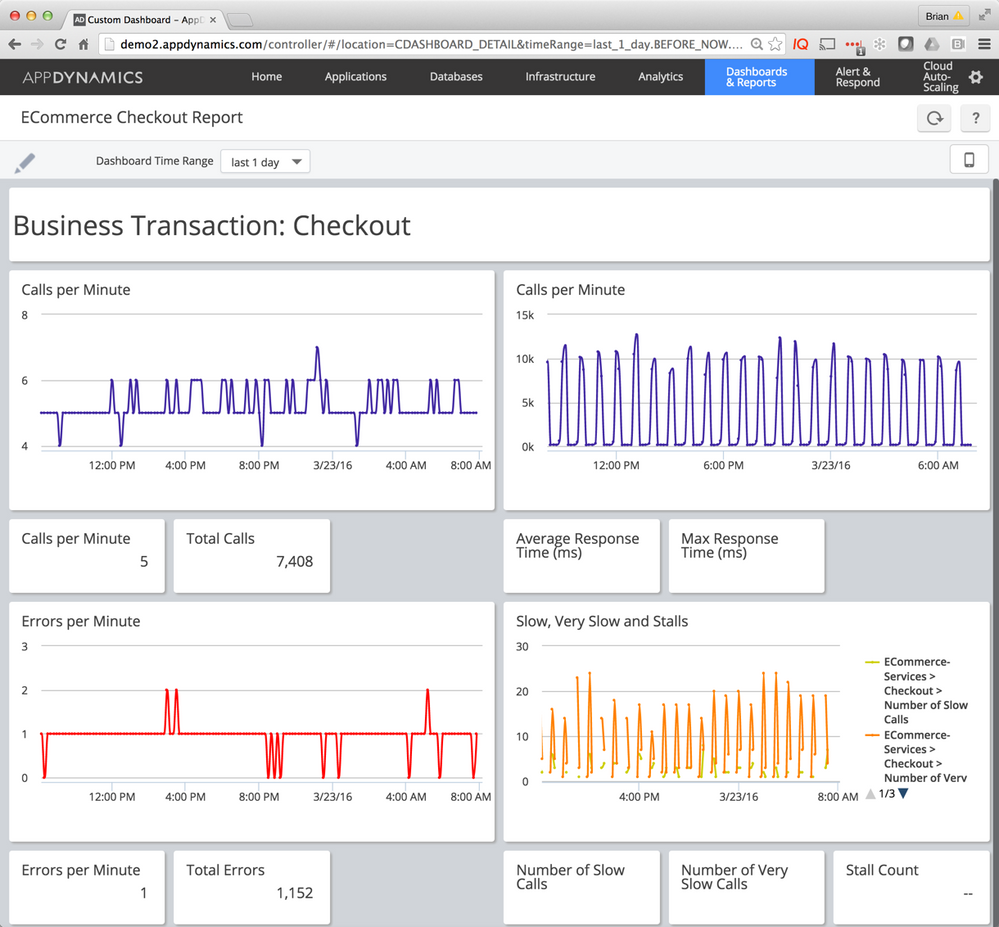
Sample dashboard with key metrics for a Business Transaction (BT)
This sample dashboard provides key metrics for a Business Transaction, including:
- Calls
- Response Time
- Errors, and Slow
- Very Slow
- and Stall count.
This dashboard is well suited to running as a scheduled report. Though the default time range is one day, that can be modified. A sample generated PDF is attached.
How do I use this sample dashboard?
To use this dashboard, edit the attached JSON file in a text editor.
- Replace "Homepage" with your target Business Transaction name (17 occurrences)
- Replace "SERVLET" with your target Business Transaction type (e.g., "WEB", "WEB_SERVICE", "ASP_DOTNET", etc.) (6 occurrences)
- Replace "ECommerce-Services" with the Tier that includes the target Business Transaction (24 occurrences)
- Replace "ECommerce" with your Application name (30 occurrences)
How do I install the modified dashboard?
Install the modified dashboard configuration on your Controller.
- Log in to your Controller UI (4.1 and higher).
- Navigate to the Custom Dashboards list screen.
- Import the JSON file.
- If there are any errors, rebind the metrics which correspond for your particular application. To do this, you edit each displayed widget in the dashboard, select your application and then confirm or select the metric for that display.
For detailed instructions for working with custom dashboard widgets, see Create and Manage Custom Dashboards and Templates.
Learn how Splunk and AppDynamics are redefining observability
Register Now!
Dive into our Community Blog for the Latest Insights and Updates!
Read the blog here

Thank you! Your submission has been received!
Thank you! Your submission has been received!
Oops! Something went wrong while submitting the form
