- Community Hub
- Forum Q&A
- Business iQ (Analytics)
- Controller (SaaS, On Premise)
- Dashboards
- Dynamic Languages (Node.JS, Python, PHP, C/C++, Webserver Agent)
- End User Monitoring (EUM)
- Infrastructure (Server, Network, Database)
- Java (Java Agent, Installation, JVM, and Controller Installation)
- Licensing (including Trial)
- .NET (Agent, Installation)
- Smart Agent
- General Discussions
- Resources
- Groups
- Idea Exchange
Not a customer? Click the 'Start a free trial' link to begin a 30-day SaaS trial of our product and to join our community.
Existing Cisco AppDynamics customers should click the 'Sign In' button to authenticate to access the community
- Cisco AppDynamics Community
- Resources
- Knowledge Base
- Monitoring Prometheus metric with Cisco Cloud Obse...
- Subscribe to RSS Feed
- Mark as New
- Mark as Read
- Bookmark
- Subscribe
- Printer Friendly Page
- Report Inappropriate Content
At 6pm PST, the AppDynamics Community will go into read-only mode and after migration is complete, you will be redirected to community.splunk.com.
Read more here
- Article History
- Subscribe to RSS Feed
- Mark as New
- Mark as Read
- Bookmark
- Subscribe
- Printer Friendly Page
- Report Inappropriate Content
04-22-2024 03:03 PM - edited 09-13-2024 10:53 AM
In this Knowledge Base Article, we’ll walk you through the process of collecting Prometheus metrics from a Python application, forwarding them to Cisco Cloud Observability platform using OpenTelemetry, and visualizing them for effective monitoring.
Do NOTE : Cisco Cloud Observability has been depreciated in favor or Splunk, So if you are not an existing customer that has been onboarded to Cisco Cloud Observability, This article is not for you.
Setting up the Python Application
Let’s start with creating a Python application that generates Prometheus metrics. We’ll use the prometheus_client library to create and expose these metrics. If you haven't installed the library, you can do so with:
pip3 install prometheus_client
Now, let’s dive into the Python script:
import random
import time
from prometheus_client import start_http_server, Counter, Summary

# Define Prometheus metrics
some_counter = Counter(name="myapp_some_counter_total", documentation="Sample counter")
request_latency = Summary(name="myapp_request_latency_seconds", documentation="Request latency in seconds")

def main() -> None:
    start_http_server(port=9090)
    while True:
        try:
            # Simulate application logic here
            process_request()
            time.sleep(5)  # Sleep for a few seconds between metric updates
        except KeyboardInterrupt:
            break

def process_request():
    # Simulate processing a request and record metrics
    with request_latency.time():
        random_sleep_time = random.uniform(0.1, 0.5)
        time.sleep(random_sleep_time)
    some_counter.inc()

if __name__ == "__main__":
    main()
This Python script sets up a simple HTTP server on port 9090 and generates two Prometheus metrics: myapp_some_counter_total and myapp_request_latency_seconds.
To produce the load:
- curl -v http://localhost:9090
The logs will look like:
*   Trying 127.0.0.1:8081...
* Connected to localhost (127.0.0.1) port 8081 (#0)
> GET / HTTP/1.1
> Host: localhost:8081
> User-Agent: curl/7.81.0
> Accept: */*
>
* Mark bundle as not supporting multiuse
* HTTP 1.0, assume close after body
< HTTP/1.0 200 OK
< Date: Thu, 07 Dec 2023 15:58:00 GMT
< Server: WSGIServer/0.2 CPython/3.10.12
< Content-Type: text/plain; version=0.0.4; charset=utf-8
< Content-Length: 2527
<
# HELP python_gc_objects_collected_total Objects collected during gc
# TYPE python_gc_objects_collected_total counter
python_gc_objects_collected_total{generation="0"} 371.0
python_gc_objects_collected_total{generation="1"} 33.0
python_gc_objects_collected_total{generation="2"} 0.0
# HELP python_gc_objects_uncollectable_total Uncollectable objects found during GC
# TYPE python_gc_objects_uncollectable_total counter
python_gc_objects_uncollectable_total{generation="0"} 0.0
python_gc_objects_uncollectable_total{generation="1"} 0.0
python_gc_objects_uncollectable_total{generation="2"} 0.0
# HELP python_gc_collections_total Number of times this generation was collected
# TYPE python_gc_collections_total counter
python_gc_collections_total{generation="0"} 40.0
python_gc_collections_total{generation="1"} 3.0
python_gc_collections_total{generation="2"} 0.0
Deploying OpenTelemetry Collector
To collect and forward metrics to Cisco Cloud Observability, we’ll use OpenTelemetry Collector. This component plays a vital role in gathering metrics from various sources and exporting them to different backends. In this case, we’ll configure it to forward metrics to AppDynamics.
Installing OpenTelemetry Collector on Ubuntu
- Make sure you’re on an Ubuntu machine. If not, adjust the installation instructions accordingly.
- Install OpenTelemetry Collector:
https://medium.com/@abhimanyubajaj98/linux-host-monitoring-with-appdynamics-deploying-opentelemetry-... - For this tutorial, we will edit /opt/appdynamics/appdynamics.conf and add another variable called:
APPD_OTELCOL_EXTRA_CONFIG=--config=file:/opt/appdynamics/config.yamlOur appdynamics.conf file will look like:
APPD_OTELCOL_CLIENT_ID=<client-id>
APPD_OTELCOL_CLIENT_SECRET=<client-secret>
APPD_OTELCOL_TOKEN_URL=<tenant-url>
APPD_OTELCOL_ENDPOINT_URL=<tenant_endpoint>
APPD_LOGCOL_COLLECTORS_LOGGING_ENABLED=true
APPD_OTELCOL_EXTRA_CONFIG=--config=file:/opt/appdynamics/config.yaml
We will create the config.yaml like below.
Configuring OpenTelemetry Collector
Create an config.yaml configuration file with the following content:
extensions:
  oauth2client:
    client_id: "${env:APPD_OTELCOL_CLIENT_ID}"
    client_secret: "${env:APPD_OTELCOL_CLIENT_SECRET}"
    token_url: "${env:APPD_OTELCOL_TOKEN_URL}"
  health_check:
    endpoint: 0.0.0.0:13133
  zpages:
    endpoint: 0.0.0.0:55679

receivers:
  otlp:
    protocols:
      grpc:
        endpoint: 0.0.0.0:4317
      http:
        endpoint: 0.0.0.0:4318
  prometheus:
    config:
      scrape_configs:
        - job_name: 'prometheus'
          static_configs:
            - targets: ['localhost:9090']

processors:
  # defaults based on perf testing for k8s nodes
  batch:
    send_batch_size: 1000
    timeout: 10s
    send_batch_max_size: 1000

  memory_limiter:
    check_interval: 5s
    limit_mib: 1536

exporters:
  otlphttp:
    retry_on_failure:
      max_elapsed_time: 180
    metrics_endpoint: "${env:APPD_OTELCOL_ENDPOINT_URL}/v1/metrics"
    traces_endpoint: "${env:APPD_OTELCOL_ENDPOINT_URL}/v1/trace"
    logs_endpoint: "${env:APPD_OTELCOL_ENDPOINT_URL}/v1/logs"
    auth:
      authenticator: oauth2client

service:
  telemetry:
        logs:
          level: debug
  extensions: [zpages, health_check, oauth2client]
  pipelines:
    metrics:
      receivers: [prometheus, otlp]
      processors: [memory_limiter, batch]
      exporters: [otlphttp]
    traces:
      receivers: [otlp]
      processors: [memory_limiter, batch]
      exporters: [otlphttp]
In this configuration file, we have set up the OpenTelemetry Collector to receive metrics from the Prometheus receiver and export them to Cisco Cloud Observability using the OTLP exporter.
Forwarding Metrics to Cisco Cloud Observability
With the OpenTelemetry Collector configured, it will now collect metrics from your Python application and forward them to Cisco Cloud Observability. This seamless integration enables you to monitor your application’s performance in real-time.
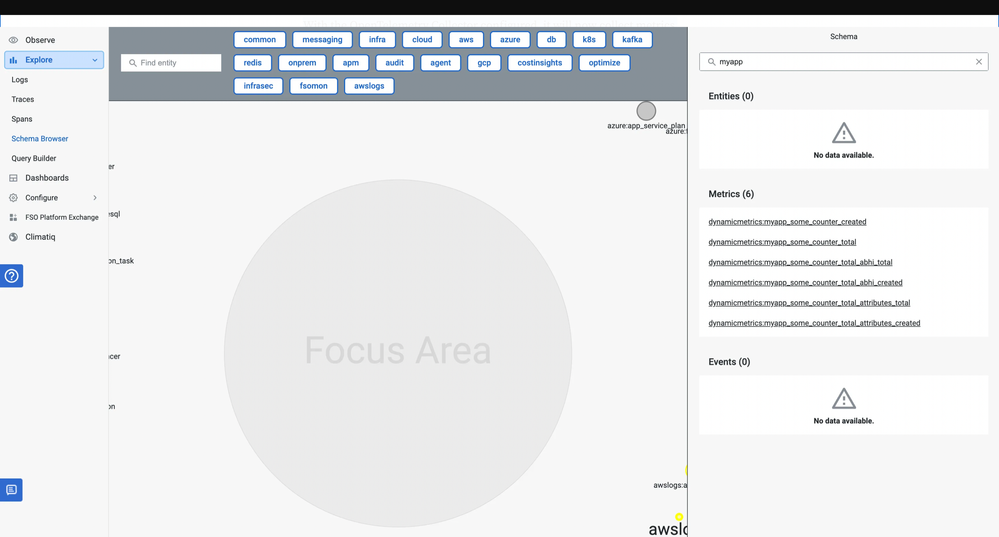
Monitoring Metrics in AppDynamics
You can use UQL to query the metrics.
This is a very basic example, you can create attributes.
To learn more about the AppDynamics metric model, check out this AppDynamics Docs page
- Mark as Read
- Mark as New
- Bookmark
- Permalink
- Report Inappropriate Content
PLEASE NOTE!
This article refers to the Cisco Observability Platform and Cisco Cloud Observability Product. Which has now been sunsetted in favour of Splunk Observability Cloud.
This is not meant for AppDynamics. As of this writing, AppDynamics only supports traces from OpenTelemetry and not metrics.
Join us on Feb 26 to explore Splunk AppDynamics deployment strategies, SaaS models, agent rollout plans, and expert best practices.
Register Now
Dive into our Community Blog for the Latest Insights and Updates!
Read the blog here

Thank you! Your submission has been received!
Thank you! Your submission has been received!
Oops! Something went wrong while submitting the form
