- Community Hub
- Forum Q&A
- Business iQ (Analytics)
- Cisco Cloud Observability
- Controller (SaaS, On Premise)
- Dashboards
- Dynamic Languages (Node.JS, Python, PHP, C/C++, Webserver Agent)
- End User Monitoring (EUM)
- Infrastructure (Server, Network, Database)
- Java (Java Agent, Installation, JVM, and Controller Installation)
- Licensing (including Trial)
- .NET (Agent, Installation)
- Privacy and Security
- Smart Agent
- General Discussions
- Resources
- Groups
- Idea Exchange
Not a customer? Click the 'Start a free trial' link to begin a 30-day SaaS trial of our product and to join our community.
Existing Cisco AppDynamics customers should click the 'Sign In' button to authenticate to access the community
- Cisco AppDynamics Community
- Resources
- Knowledge Base
- Confirming BT Instrumentation for Web Frameworks
- Subscribe to RSS Feed
- Mark as New
- Mark as Read
- Bookmark
- Subscribe
- Printer Friendly Page
- Report Inappropriate Content
- Article History
- Subscribe to RSS Feed
- Mark as New
- Mark as Read
- Bookmark
- Subscribe
- Printer Friendly Page
- Report Inappropriate Content
on 02-23-2015 03:18 PM - edited on 11-19-2018 07:55 AM by Nina.Wolinsky
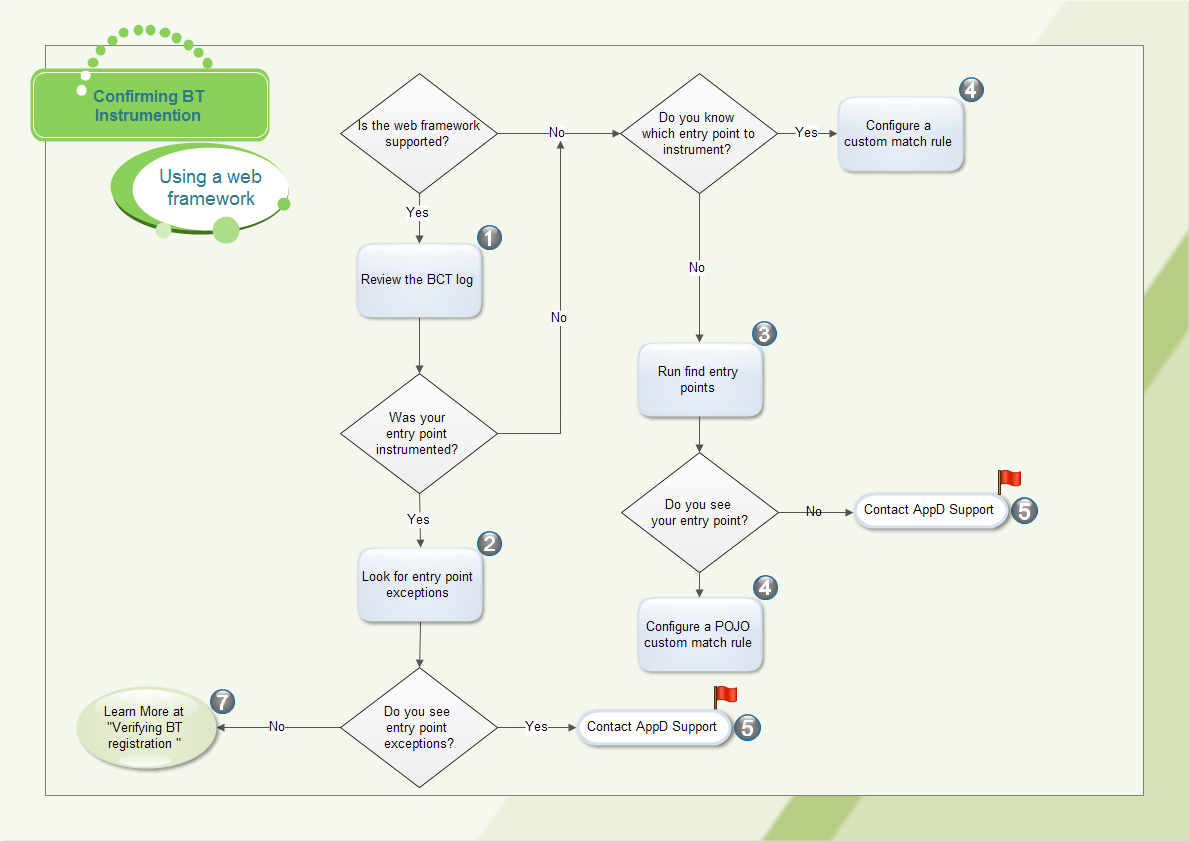
This flowchart describes the steps to confirm BT instrumentation when you are using a web framework. For a complete description of the BT Life Cycle, see: Business Transaction Discovery Life Cycle.
Supported Framework?
First check our lists of supported environments to see if your framework is one that is discovered automatically by your agent: App Server Agents Supported Environments
1. Review the BCT Log
Retrieve the Bytecode Transformer Log and look for entry point interceptors starting with entry.<your_framework> - for example, "entry.servlet" or "entry.struts". See Agent Log Files for details on requesting the agent logs.
2. Look for Entry Point Exceptions
If you find evidence in the BCT log that the entry point was instrumented, look in the agent logs for entry point exceptions. See Request Agent Log Files for details on requesting agent logs.
If you find exceptions for your entry point, contact AppDynamics support for additional assistance.
If you do not see exceptions, review this article Business Transaction Discovery Life Cycle and use the steps at Phase 2 to verify registration with the controller.
3. Run Find Entry Points
Use the procedure here Find Entry Points
4 Configure POJO or POCO Custom Match Rule
For details see POJO Entry Points or POCO Entry Points.
5. Contact AppDynamics Support
http://www.appdynamics.com/support/
6. Verifying BT Registration
If your entry point was instrumented and there were no related entry point exceptions, you can move to phase 2 - BT registration: Business Transaction Discovery Life Cycle.
Learn how Splunk and AppDynamics are redefining observability
Register Now!
Dive into our Community Blog for the Latest Insights and Updates!
Read the blog here

Thank you! Your submission has been received!
Thank you! Your submission has been received!
Oops! Something went wrong while submitting the form
