- Community Hub
- Forum Q&A
- Business iQ (Analytics)
- Controller (SaaS, On Premise)
- Dashboards
- Dynamic Languages (Node.JS, Python, PHP, C/C++, Webserver Agent)
- End User Monitoring (EUM)
- Infrastructure (Server, Network, Database)
- Java (Java Agent, Installation, JVM, and Controller Installation)
- Licensing (including Trial)
- .NET (Agent, Installation)
- Smart Agent
- General Discussions
- Resources
- Groups
- Idea Exchange
Not a customer? Click the 'Start a free trial' link to begin a 30-day SaaS trial of our product and to join our community.
Existing Cisco AppDynamics customers should click the 'Sign In' button to authenticate to access the community
- Cisco AppDynamics Community
- Resources
- Knowledge Base
- Auto-Instrumentation with AppDynamics Cluster agen...
- Subscribe to RSS Feed
- Mark as New
- Mark as Read
- Bookmark
- Subscribe
- Printer Friendly Page
- Report Inappropriate Content
- Article History
- Subscribe to RSS Feed
- Mark as New
- Mark as Read
- Bookmark
- Subscribe
- Printer Friendly Page
- Report Inappropriate Content
03-13-2024 02:07 PM - edited 03-13-2024 02:19 PM
Introduction
In the fast-evolving Kubernetes ecosystem, ensuring optimal performance and reliability of applications is crucial. AppDynamics offers a seamless way to monitor your Java applications deployed in Kubernetes clusters. This Medium article guides you through integrating your application with AppDynamics for comprehensive monitoring and observability, leveraging OpenTelemetry Collector for enhanced telemetry data collection.
Prerequisites
Before diving into deployment, ensure the following:
- AppDynamics Controller Onboarding: Your AppDynamics Controller should be onboarded. Follow the integration guide here.
- Java Application Configuration: Your Java application must be capable of communicating with the OpenTelemetry Collector.
Deployment Steps
1. Prepare Deployment YAML
To begin, prepare your deployment YAML to deploy your application alongside an OpenTelemetry Collector sidecar. This configuration ensures the collection and forwarding of telemetry data to AppDynamics, enriching your monitoring insights.
The deployment configuration involves:
- An application named
unified-monitoring-java-appwithin theappd-cloud-appsnamespace. - Two containers: your application (
abhimanyubajaj98/unified-monitoring-java-app) and the OpenTelemetry Collector sidecar (otel/opentelemetry-collector-contrib:latest). - A ConfigMap named
agent-configsupplying the OpenTelemetry Collector configuration (agent.yaml).
2. YAML Configuration
Here’s a snapshot of the YAML configuration needed:
apiVersion: apps/v1
kind: Deployment
metadata:
  name: unified-monitoring-java-app
  labels:
    app: unified-monitoring-java-app
  namespace: appd-cloud-apps
spec:
  replicas: 1
  selector:
    matchLabels:
      app: unified-monitoring-java-app
  template:
    metadata:
      labels:
        app: unified-monitoring-java-app
    spec:
      volumes:
      - name: sidecar-otel-collector-config
        configMap:
          name: agent-config
          items:
          - key: agent.yaml
            path: agent.yaml
      containers:
      - name: sidecar-otel-collector
        image: docker.io/otel/opentelemetry-collector-contrib:latest
        args:
          - --config=/conf/agent.yaml
        volumeMounts:
        - name: sidecar-otel-collector-config
          mountPath: /conf
      - name: unified-monitoring-java-app
        image: abhimanyubajaj98/unified-monitoring-java-app
        imagePullPolicy: Always
        ports:
        - containerPort: 8080
        env:
        - name: JAVA_TOOL_OPTIONS
          value: "-Xmx512m"
And the corresponding service:
apiVersion: v1
kind: Service
metadata:
  name: unified-monitoring-java-app
  labels:
    app: unified-monitoring-java-app
  namespace: appd-cloud-apps
spec:
  ports:
  - port: 8080
    targetPort: 8080
  selector:
    app: unified-monitoring-java-app
For detailed YAML configurations and the ConfigMap (agent.yaml), please refer to the provided snippets above.
---
apiVersion: v1
kind: ConfigMap
metadata:
  name: agent-config
  namespace: appd-cloud-apps
data:
  agent.yaml: |
   receivers:
    otlp:
      protocols:
        grpc:
          endpoint:
        http:
          endpoint:
   processors:
    batch:
      send_batch_size: 1000
      timeout: 10s
      send_batch_max_size: 1000
   exporters:
    logging:
      verbosity: detailed
    otlphttp/cnao:
      auth:
        authenticator: oauth2client
      #endpoint: https://xxxx-pdx-p01-c4.observe.appdynamics.com/data
      traces_endpoint: https://xxxx-pdx-p01-c4.observe.appdynamics.com/data/v1/trace
      logs_endpoint: https://xxx-pdx-p01-c4.observe.appdynamics.com/data/v1/logs
   extensions:
     health_check:
       endpoint: 0.0.0.0:13133
     pprof:
       endpoint: 0.0.0.0:17777
     oauth2client:
       client_id: xxxx
       client_secret: xxxx
       token_url: https://xxxx-pdx-p01-c4.observe.appdynamics.com/auth/xxx-xxx-xx-xx-xxxx/default/oauth2/token
      #tenantId: xx-xxx-xx-xx-xxx
   service:
    extensions: [health_check, pprof, oauth2client]
    pipelines:
      traces:
        receivers: [otlp]
        processors: [batch]
        exporters: [logging, otlphttp/cnao]
      logs:
        receivers: [otlp]
        processors: [batch]
        exporters: [logging, otlphttp/cnao]
    telemetry:
        logs:
          level: "debug"
Ensure to replace client_id, client_secret, token_url, and controller-key with your actual credentials.
3. Deployment
To deploy, execute the following commands:
- Create the namespace (if not already present):
kubectl create ns appd-cloud-apps
2. Apply the ConfigMap and deployment files:
kubectl create -f agent.yaml
kubectl create -f unified-monitoring-java-app.yaml
4. Integrate with AppDynamics Cluster Agent
Deploy the AppDynamics Cluster Agent using Helm charts with specific parameters to enable OpenTelemetry.
Our values.yaml looks like:
installClusterAgent: true
installInfraViz: true

# Docker images
imageInfo:
  agentImage: docker.io/appdynamics/cluster-agent
  agentTag: 24.1.0-253
  #agentTag: 22.1.0
  operatorImage: docker.io/appdynamics/cluster-agent-operator
  #operatorTag: 22.1.0
  operatorTag: 24.1.0-694
  imagePullPolicy: Always                               # Will be used for operator pod
  machineAgentImage: docker.io/appdynamics/machine-agent-analytics
  machineAgentTag: latest
  machineAgentWinImage: docker.io/appdynamics/machine-agent-analytics
  machineAgentWinTag: win-latest
  netVizImage: docker.io/appdynamics/machine-agent-netviz
  netvizTag: latest

# AppDynamics controller info (VALUES TO BE PROVIDED BY THE USER)
controllerInfo:
  url: https://xxxx.saas.appdynamics.com:443
  account: xxxx
  username:
  password:
  accessKey:
  globalAccount: cxxxxx          # To be provided when using machineAgent Window Image
  # SSL properties
  customSSLCert: null

  # Proxy config
  authenticateProxy: false
  proxyUrl: null
  proxyUser: null
  proxyPassword: null

# RBAC config
createServiceAccount: true
agentServiceAccount: appdynamics-cluster-agent
operatorServiceAccount: appdynamics-operator
infravizServiceAccount: appdynamics-infraviz

# Cluster agent config
clusterAgent:
  nsToMonitorRegex: abhi-java-apps
  appName: k8s-aks-abhi
  logProperties:
    logFileSizeMb: 5
    logFileBackups: 3
    logLevel: TRACE


# Profiling specific config - set pprofEnabled true if profiling need to be enabled,
# provide pprofPort if you need different port else default port 9991 will be assigned
agentProfiler:
  pprofEnabled: false
  pprofPort: 9991

instrumentationConfig:
  enabled: true
  instrumentationMethod: Env #Env
  enableForceReInstrumentation: true
  nsToInstrumentRegex: appd-cloud-apps #any namespace you want to instrument
  defaultAppName: Abhi-personal-tomcat
  appNameStrategy: label
  numberOfTaskWorkers: 4
  resourcesToInstrument:
  - Deployment
  - StatefulSet
  instrumentationRules:
    - namespaceRegex: appd-cloud-apps
      matchString: unified-monitoring-java-app
      language: java
      appNameLabel: app
      instrumentContainer: select
      containerMatchString: unified-monitoring-java-app
      customAgentConfig: "-Dotel.traces.exporter=none -Dotel.metrics.exporter=none -Dotel.logs.exporter=otlp -Dappdynamics.opentelemetry.enabled=true -Dotel.resource.attributes=service.name=unified-monitoring-java-app,service.namespace=unified-monitoring-java-app"
      imageInfo:
        image: "docker.io/appdynamics/java-agent:latest"
        agentMountPath: /opt/appdynamics
        imagePullPolicy: Always
# Netviz config
Important arguments we need to remember are:
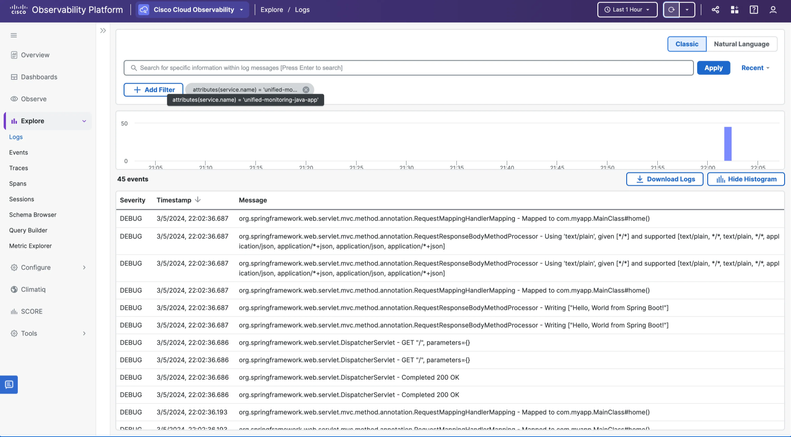
customAgentConfig: "-Dotel.traces.exporter=none -Dotel.metrics.exporter=none -Dotel.logs.exporter=otlp -Dappdynamics.opentelemetry.enabled=true -Dotel.resource.attributes=service.name=unified-monitoring-java-app,service.namespace=unified-monitoring-java-app"
To deploy:
kubectl -n appdynamics create secret generic cluster-agent-secret --from-literal=controller-key=xxxxx
helm install -f values.yaml abhi-cluster-agent appdynamics-cloud-helmcharts/cluster-agent -n appdynamics
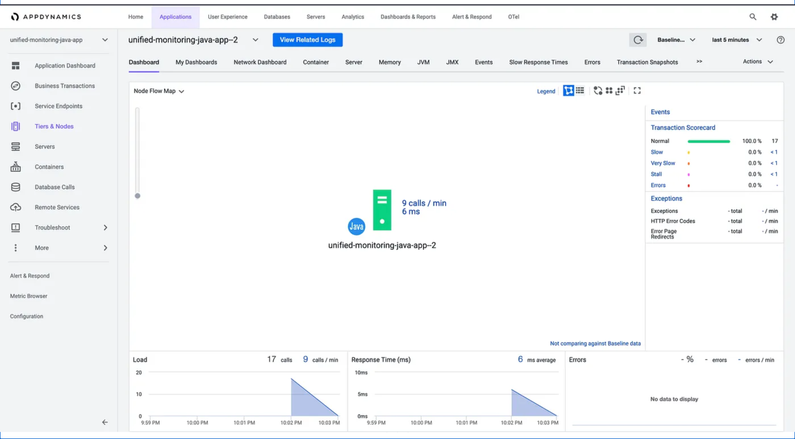
Once done, Your application pods will restart and report to the controller with unified-monitoring-java-app Application name.
Conclusion
Upon completion, your application pods will restart and begin reporting to the AppDynamics Controller with the specified application name. This setup not only simplifies monitoring across Kubernetes clusters but also ensures that your applications are performing optimally, with detailed insights readily available in your AppDynamics dashboard.
For further customization and advanced configuration, visit the official AppDynamics documentation.
Join us on Feb 26 to explore Splunk AppDynamics deployment strategies, SaaS models, agent rollout plans, and expert best practices.
Register Now
Dive into our Community Blog for the Latest Insights and Updates!
Read the blog here

Thank you! Your submission has been received!
Thank you! Your submission has been received!
Oops! Something went wrong while submitting the form


