- Community Hub
- Forum Q&A
- Business iQ (Analytics)
- Cisco Cloud Observability
- Controller (SaaS, On Premise)
- Dashboards
- Dynamic Languages (Node.JS, Python, PHP, C/C++, Webserver Agent)
- End User Monitoring (EUM)
- Infrastructure (Server, Network, Database)
- Java (Java Agent, Installation, JVM, and Controller Installation)
- Licensing (including Trial)
- .NET (Agent, Installation)
- Privacy and Security
- Smart Agent
- General Discussions
- Resources
- Groups
- Idea Exchange
Not a customer? Click the 'Start a free trial' link to begin a 30-day SaaS trial of our product and to join our community.
Existing Cisco AppDynamics customers should click the 'Sign In' button to authenticate to access the community
- Cisco AppDynamics Community
- Forums Q&A
- Java
- Re: Average response time seems to be not correct ...
- Subscribe to RSS Feed
- Mark Topic as New
- Mark Topic as Read
- Float this Topic for Current User
- Bookmark
- Subscribe
- Mute
- Printer Friendly Page
Average response time seems to be not correct (for JDBC and Web Service calls)
- Mark as New
- Bookmark
- Subscribe
- Mute
- Subscribe to RSS Feed
- Permalink
- Report Inappropriate Content
01-02-2018 07:49 PM
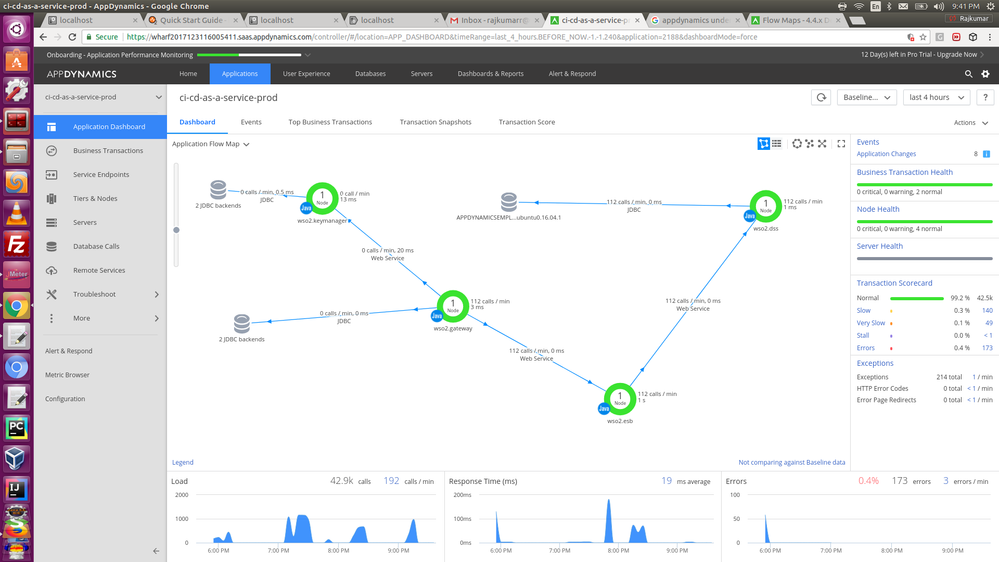
Refer the below screenshot. If I interpret this graph correctly, the time displayed on the connection between two nodes represents the average response time of that remote network call (network latency + execution time in the downstream node). For example, wso2.esb -> wso2.dss connection says 112 calls/min, 0ms and it's a web service calls. Any idea why the JDBC and Web Service calls' average response time is 0 ms? Similarly why the JDBC calls says it takes only 0 ms? Or this time represents network latency only?
- Mark as New
- Bookmark
- Subscribe
- Mute
- Subscribe to RSS Feed
- Permalink
- Report Inappropriate Content
01-02-2018 08:04 PM
Also what's the response time graph at the bottom of this flowmap dashboard represents? End to end latency across all tiers or the latency within the first tier?
- Mark as New
- Bookmark
- Subscribe
- Mute
- Subscribe to RSS Feed
- Permalink
- Report Inappropriate Content
01-02-2018 11:28 PM
Hi Rajkumar,
1. Any idea why the JDBC and Web Service calls' average response time is 0 ms? Similarly why the JDBC calls says it takes only 0 ms?
- Average response time ‘0 ms’ reporting is because on average the response over an hour < 1 ms which is reported as zero.
2. what's the response time graph at the bottom of this flowmap dashboard represents?
- It represents the average response time of the application ci-cd-as-a-service-prod.
- Mark as New
- Bookmark
- Subscribe
- Mute
- Subscribe to RSS Feed
- Permalink
- Report Inappropriate Content
01-03-2018 07:45 AM
Thanks for the response, but it doesn't seem to be correct.
If you see the wso2.gateway to wso2.esb connection, it says 0 ms as the response time, but if you can see wso2.esb node's average processing time, it says 1 sec. How can be the average response time 0 ms?These two metrics are condtracting.
Similarly, given that the wso2.esb node's average processing time is 1 sec, how can be the average response time of ci-cd-as-a-service-prod app can be less than that, not even close to 1 sec?
Regards
Raj
- Mark as New
- Bookmark
- Subscribe
- Mute
- Subscribe to RSS Feed
- Permalink
- Report Inappropriate Content
01-03-2018 07:52 AM - edited 01-03-2018 07:52 AM
We could tell for sure with a full transaction snapshot, but it is likely that the wso2 gateway is implemented asynchronously internally, meaning the backend response time that the agent registers reflects the time taken to send the request downstream.
You could investigate setting up end to end demarcation to measure the response time.
I recommend you work with support via a ticket if you need heklp with this.
Warm regards,
Peter
- Mark as New
- Bookmark
- Subscribe
- Mute
- Subscribe to RSS Feed
- Permalink
- Report Inappropriate Content
01-03-2018 08:05 AM
Hi Peter,
Yes, wso2.gateway and wso2.esb are using non-blocking transport. Meaning, they send request to backend, registrer a callback and return immediately, they don't wait for the response. So the time displayed on top of the connection arrow is just including the time wso2.gateway takes to send the request to wso2.esb.
Now the question is, wso2.gateway and wso2.esb both are using the same mediation implementation. If I want to use end to end demarcation using class name and method, both wso2.gateway and wso2.esb will be executing this same class and method in the response path. I'm bit confused which tier appdynamics is going to consider as the logical endpoint, wso2.esb or wso2.gateway?
Regards
Raj
- Mark as New
- Bookmark
- Subscribe
- Mute
- Subscribe to RSS Feed
- Permalink
- Report Inappropriate Content
01-03-2018 08:43 AM - edited 01-03-2018 08:44 AM
Hi Peter,
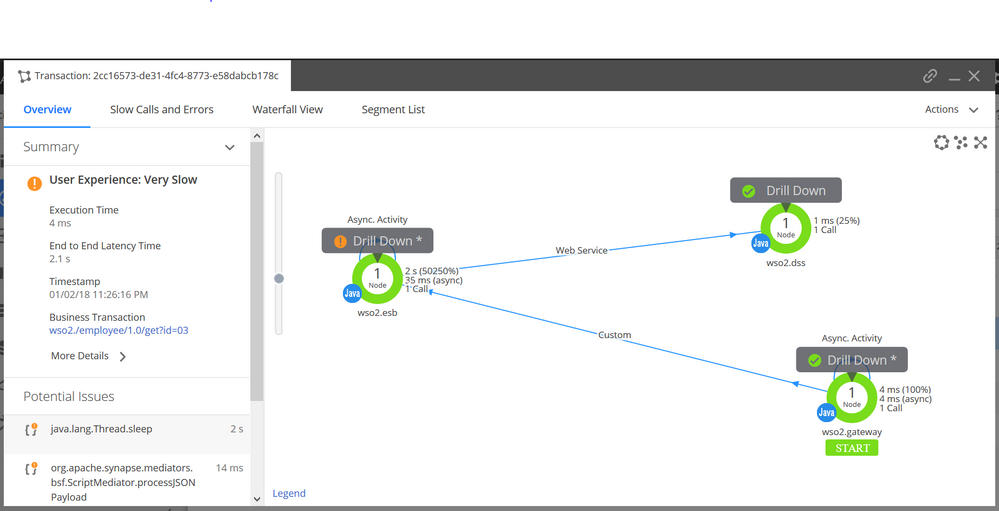
I've setup end to end demarcation using class name and method. Below is a snapshot, it shows end to end latency as 2.1 sec. Not sure which tier appdynamics considered as the logical endpoint (because the same class/method is executed in two tiers).
I have another question in the metrics presented in this snapshot. It says transaction execution time in wso2.esb is 2 sec (50250%). I'm using a thread sleep for 2 sec in wso2.esb, so execution time within wso2.esb is correctly presented, but what is this 50250% ?
Also why there is no response time displayed on the connecting arrows (wso2.gateway to wso2.esb and wso2.esb to wso2.dss)?
Regrds
Raj
Discover new Splunk integrations and AI innovations for Cisco AppDynamics.
Register Now!
Dive into our Community Blog for the Latest Insights and Updates!
Read the blog here
- Is there a way to get Service Endpoint values (response time, load, errors) into Analytics so it can be queried? in Business iQ (Analytics)
- My problem with baselines and moving averages ingesting bad data in General Discussions
- Unable to Schedule a synthetic Job in appdynamics in End User Monitoring (EUM)
- The page 'Experience Journey Map' in EUM component shows an error message in End User Monitoring (EUM)
- Events service shows critical after fresh installation in Controller (SaaS, On Premises)

Thank you! Your submission has been received!
Thank you! Your submission has been received!
Oops! Something went wrong while submitting the form

