- Community Hub
- Forum Q&A
- Business iQ (Analytics)
- Controller (SaaS, On Premise)
- Dashboards
- Dynamic Languages (Node.JS, Python, PHP, C/C++, Webserver Agent)
- End User Monitoring (EUM)
- Infrastructure (Server, Network, Database)
- Java (Java Agent, Installation, JVM, and Controller Installation)
- Licensing (including Trial)
- .NET (Agent, Installation)
- Smart Agent
- General Discussions
- Resources
- Groups
- Idea Exchange
Not a customer? Click the 'Start a free trial' link to begin a 30-day SaaS trial of our product and to join our community.
Existing Cisco AppDynamics customers should click the 'Sign In' button to authenticate to access the community
- Cisco AppDynamics Community
- Forums Q&A
- Java
- Servlet transaction's call graph is not shown
- Subscribe to RSS Feed
- Mark Topic as New
- Mark Topic as Read
- Float this Topic for Current User
- Bookmark
- Subscribe
- Mute
- Printer Friendly Page
At 6pm PST, the AppDynamics Community will go into read-only mode and after migration is complete, you will be redirected to community.splunk.com.
Read more here
Servlet transaction's call graph is not shown
- Mark as New
- Bookmark
- Subscribe
- Mute
- Subscribe to RSS Feed
- Permalink
- Report Inappropriate Content
01-02-2018 04:22 PM
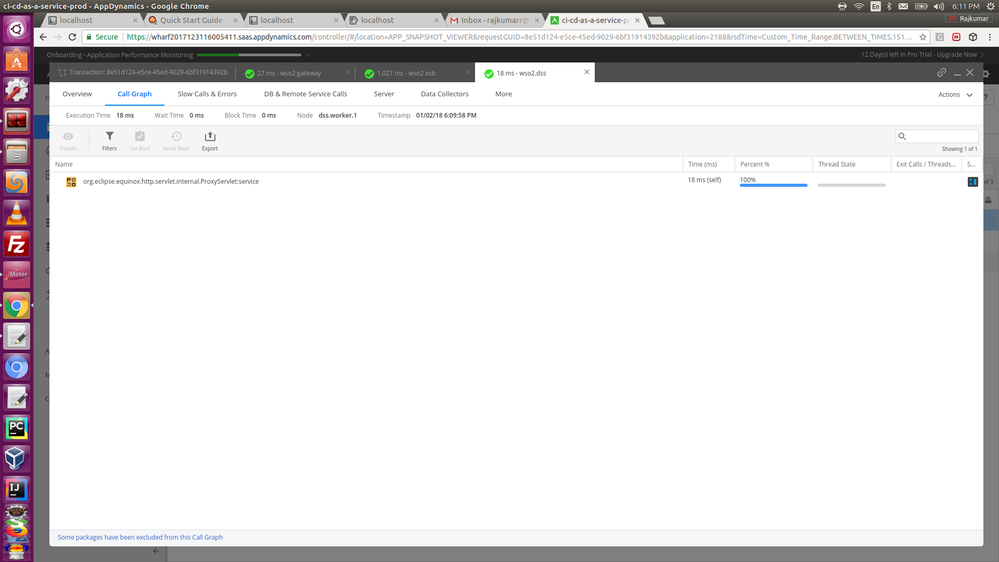
I manually triggered a diagnostic session to capture some snapshots of a servlet service deployed on WSO2 DSS. Snapshots are taken, but I'm not able to see the complete call graph, seeing only the first line. Execution time was 18 ms. See the below screenshot. What should I do to see the call graph?
- Mark as New
- Bookmark
- Subscribe
- Mute
- Subscribe to RSS Feed
- Permalink
- Report Inappropriate Content
01-02-2018 07:51 PM
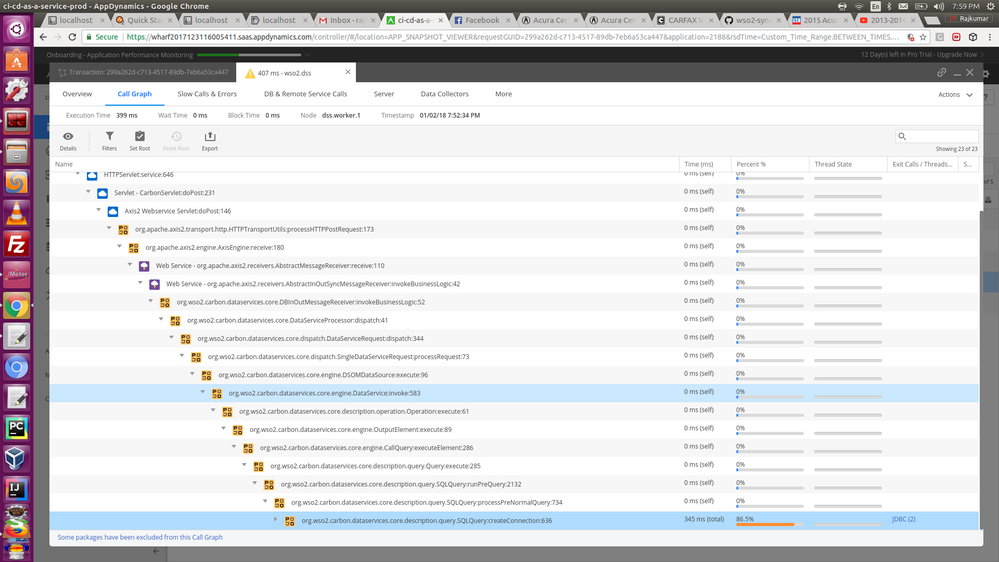
I was able to get the call graph when the execution time is bit high, around 400ms. See the below screenshot. Question is, what should be the minium execution time inorder for appdynamics to be able to capture the call graph? I read somewhere it's only 10 ms, but it doesn't seem to be the case.
- Mark as New
- Bookmark
- Subscribe
- Mute
- Subscribe to RSS Feed
- Permalink
- Report Inappropriate Content
01-03-2018 07:13 AM
Business Transaction execution within a snapshot is profiled every 10ms, as you state. In your 18ms snapshot, it is likely that whatever methods within the servlet ran did not individually last long enough to be detected by the profiler.
Given the short execution time I would imagine that whatever these methods are, they are unlikely to represent a performance problem.
Warm regards,
Peter
Join us on Feb 26 to explore Splunk AppDynamics deployment strategies, SaaS models, agent rollout plans, and expert best practices.
Register Now
Dive into our Community Blog for the Latest Insights and Updates!
Read the blog here
- My problem with baselines and moving averages ingesting bad data in Controller (SaaS, On Premises)
- Java auto detected servlet transactions are masked with "Not Found" business transaction in Controller (SaaS, On Premises)
- OpenTelemetry business transactions only show HTTP Post in General Discussions
- Transaction Detection rules don't work in Java (Java Agent, Installation, JVM, and Controller Installation)
- what exactly is a business transaction in Dashboards

Thank you! Your submission has been received!
Thank you! Your submission has been received!
Oops! Something went wrong while submitting the form

