- Community Hub
- Forum Q&A
- Business iQ (Analytics)
- Controller (SaaS, On Premise)
- Dashboards
- Dynamic Languages (Node.JS, Python, PHP, C/C++, Webserver Agent)
- End User Monitoring (EUM)
- Infrastructure (Server, Network, Database)
- Java (Java Agent, Installation, JVM, and Controller Installation)
- Licensing (including Trial)
- .NET (Agent, Installation)
- Smart Agent
- General Discussions
- Resources
- Groups
- Idea Exchange
Not a customer? Click the 'Start a free trial' link to begin a 30-day SaaS trial of our product and to join our community.
Existing Cisco AppDynamics customers should click the 'Sign In' button to authenticate to access the community
- Cisco AppDynamics Community
- Forums Q&A
- Java
- Re: LOAD graph values on Tier Flow Map view
- Subscribe to RSS Feed
- Mark Topic as New
- Mark Topic as Read
- Float this Topic for Current User
- Bookmark
- Subscribe
- Mute
- Printer Friendly Page
At 6pm PST, the AppDynamics Community will go into read-only mode and after migration is complete, you will be redirected to community.splunk.com.
Read more here
LOAD graph values on Tier Flow Map view
- Mark as New
- Bookmark
- Subscribe
- Mute
- Subscribe to RSS Feed
- Permalink
- Report Inappropriate Content
02-26-2020 08:05 AM - edited 02-26-2020 08:31 AM
Hi,
We have several tiers with several Business Transactions and several Service Endpoints (in fact almost the traffic used to be detected under Service Endpoints) but the load values are not the expected ones.
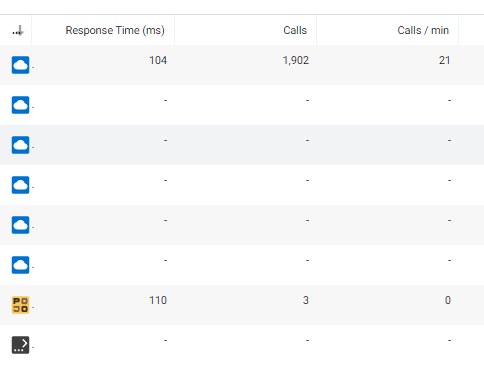
The tier flow map shows the following load:
That seems to be the Business Transactions values:
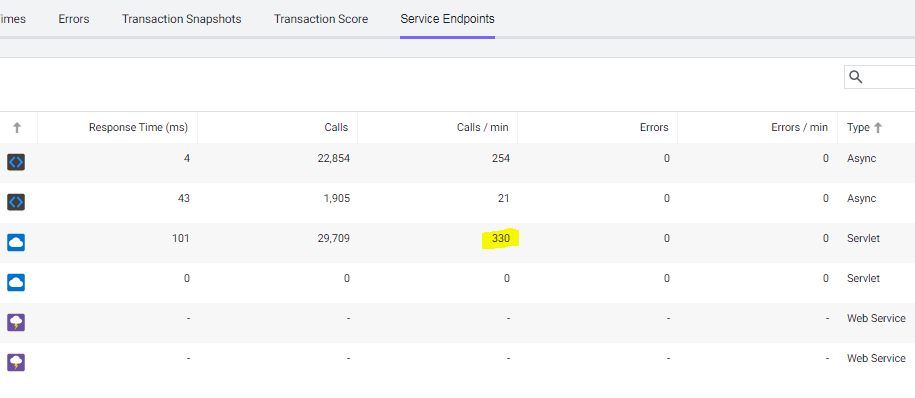
But the service endpoints of that tier are executing a lot of calls (a higher value of calls):
The Service endpoint load graph displays the expected values:
From our point of view the tier load should take into account all the calls under the BTs, I mean, also add all the service endpoints calls, but seems not be the case...
We need to confirm how dbAPM calculates the calls values displayed in the Load graph under the Tier Flow Map view.
Which entities are taking into account to obtain that values?
Please kindly confirm it.
Thanks a lot in advance!
- Mark as New
- Bookmark
- Subscribe
- Mute
- Subscribe to RSS Feed
- Permalink
- Report Inappropriate Content
02-26-2020 01:46 PM
Hi. Since SEPs are a totally separate set of detection rules, this makes sense. The BT detection and SEP detection would have to be exactly the same for the numbers to match.
- Mark as New
- Bookmark
- Subscribe
- Mute
- Subscribe to RSS Feed
- Permalink
- Report Inappropriate Content
02-26-2020 11:50 PM - edited 02-26-2020 11:53 PM
Thanks Alan,
In this case the number of calls for an specific BT (21 calls/min) is much lower than the number of executions (330 calls/min) of the SE associated to that BT.
So the load graph at tier level is not reflecting the real traffic of those nodes.
How to solve it please?
Thanks
- Mark as New
- Bookmark
- Subscribe
- Mute
- Subscribe to RSS Feed
- Permalink
- Report Inappropriate Content
02-27-2020 07:48 AM
I would first need to see your configuration settings for your BT's as well as SEPs. Feel free to PM or post here. Thanks. If this is urgent, please reach out to the support team.
- Mark as New
- Bookmark
- Subscribe
- Mute
- Subscribe to RSS Feed
- Permalink
- Report Inappropriate Content
02-27-2020 07:59 AM
Hi,
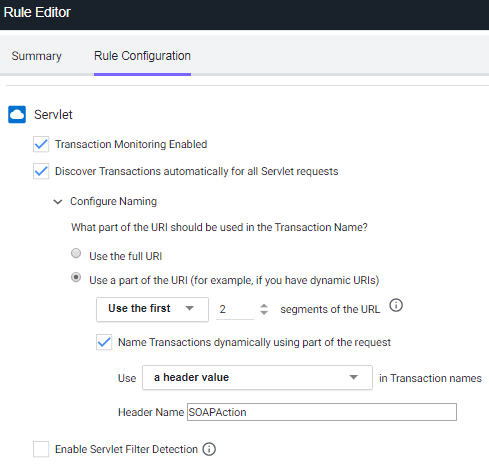
We do not have any specific configuration, just detecting the first 2 segments and including the SOAP action
But please, what we need is to confirm and verify which values are used to calculate the LOAD graph that is displayed in the Tier Flow Map.
Thanks
- Mark as New
- Bookmark
- Subscribe
- Mute
- Subscribe to RSS Feed
- Permalink
- Report Inappropriate Content
02-27-2020 08:16 AM
Hi. So these detection rules are what determine the load and other metrics. I'm wondering if using part of the SOAP request is ignoring any transactions that don't have SOAP information. I'd have to log in to your controller to really dig in to what's going on.
Either way, if you have an account manager they can get you in touch with your solutions engineer to look at this. Or you can open a support ticket if this is urgent.
- Mark as New
- Bookmark
- Subscribe
- Mute
- Subscribe to RSS Feed
- Permalink
- Report Inappropriate Content
02-27-2020 08:22 AM
Thanks Allan,
Which metrics are used to calculate the load graph? I mean, I do not understand why a BT with 21 calls/min have service endpoints associated with 330 calls/min in each node and the tier only reflects in the load the 21calls/min...
However other tiers in the same controller under the same rules detection are displaying values closer tan the expected ones.
Just trying to understand how dbAPM calculates the load and how to solve the issue...
Thanks
- Mark as New
- Bookmark
- Subscribe
- Mute
- Subscribe to RSS Feed
- Permalink
- Report Inappropriate Content
02-27-2020 08:35 AM
I wouldn't be focused on the calls / min, but rather the total number of calls in the time range (which will still be different values for you in this case).
For some reason in your controller, the detection rules for BT's is different than the config for SEPs.
- Mark as New
- Bookmark
- Subscribe
- Mute
- Subscribe to RSS Feed
- Permalink
- Report Inappropriate Content
02-28-2020 12:08 AM
Hi,
Yes we have configured it due to:
- BTs has to include the 2 segments and the soap action in order to capture the specific operation executed on the application
- SEs configuration was added because some actions are not captured as BT, it only appears as SE.
Which should be the best configuration in order to obtain a real total load in the load graph?
Thanks a lot!
- Mark as New
- Bookmark
- Subscribe
- Mute
- Subscribe to RSS Feed
- Permalink
- Report Inappropriate Content
02-28-2020 08:14 AM
Hey there, happy Friday
Join us on Feb 26 to explore Splunk AppDynamics deployment strategies, SaaS models, agent rollout plans, and expert best practices.
Register Now
Dive into our Community Blog for the Latest Insights and Updates!
Read the blog here
- file-monitoring-extension in General Discussions
- Percentage of Server availability on a dashboard in Dashboards
- Plot Date Points on Dashboard Every 30 Seconds in Dashboards
- Creating a metric for the difference between two JMX values in Java (Java Agent, Installation, JVM, and Controller Installation)

Thank you! Your submission has been received!
Thank you! Your submission has been received!
Oops! Something went wrong while submitting the form


