- Community Hub
- Forum Q&A
- Business iQ (Analytics)
- Controller (SaaS, On Premise)
- Dashboards
- Dynamic Languages (Node.JS, Python, PHP, C/C++, Webserver Agent)
- End User Monitoring (EUM)
- Infrastructure (Server, Network, Database)
- Java (Java Agent, Installation, JVM, and Controller Installation)
- Licensing (including Trial)
- .NET (Agent, Installation)
- Smart Agent
- General Discussions
- Resources
- Groups
- Idea Exchange
Not a customer? Click the 'Start a free trial' link to begin a 30-day SaaS trial of our product and to join our community.
Existing Cisco AppDynamics customers should click the 'Sign In' button to authenticate to access the community
- Cisco AppDynamics Community
- Forums Q&A
- Infrastructure
- Re: Defining Pod CPU Percent calculated by Cluster...
- Subscribe to RSS Feed
- Mark Topic as New
- Mark Topic as Read
- Float this Topic for Current User
- Bookmark
- Subscribe
- Mute
- Printer Friendly Page
How do I define Pod CPU% calculated by cluster agent?
- Mark as New
- Bookmark
- Subscribe
- Mute
- Subscribe to RSS Feed
- Permalink
- Report Inappropriate Content
06-14-2021
11:40 AM
- last edited on
12-20-2021
11:57 AM
by
Claudia.Landiva
How do I understand defining Pod CPU percentage when caculated by Linux cluster agent?
Suppose you have a Pod running on a Kubernetes cluster with the following CPU/Memory configuration:
resources:
 limits:
        cpu: "8"
        memory: 4Gi
    requests:
        cpu: "4"
        memory: 2Gi
When we do a kubectl top Pod, the output for the specific Pod is:
[root@SK8SPL01 svuser]# kubectl top pods -n abc-namespace | grep -i "abc-namespace"
abc-namespace-276371283-bndcl                4630m        2246Mi
This output means that the Pod is currently using 4630 millicores (total 4.63 CPUs) of the 8 CPUs allocated to it.
In Cluster Agent, the Pod’s CPU utilization percentage (%) shows as 463%. The standard Linux CPU utilization percentage is calculated.
No matter how many CPUs are available on a Linux machine (20 CPUs, 10 CPUs, or 5 CPUs), the CPU utilization % is calculated on how many cores are used. For example, out of 20 available CPUs, if 4 CPUs are used by a process, the CPU utilization percentage for the process will be 400%, not 20%).
Additional Resources
- Labels:
-
Infrastructure
- Mark as New
- Bookmark
- Subscribe
- Mute
- Subscribe to RSS Feed
- Permalink
- Report Inappropriate Content
06-16-2021 10:53 AM
I have couple of questions, and issues regarding this method of cpu metric calculation:
On the question front:
Is there a reason that it was chosen to make 1 cpu (or 1000 millicores) directly equivalent to 100% utilization regardless of limits on the pods themselves? I agree that comparing against all CPUs available on the host machine would be silly for pod level utilization metrics, but why the rigid assumption that 1 cpu would always be the limit?
Could the cluster agent use the available metadata on pod limits to define the true utilization within the spec of its workload? Using the example in this post, 4630m utilization with a limit of 8000m is really ~58% not 463% when taken in context with what the expected headroom for that pod is. That same 4630m would be way more concerning if the limit were 4700m, but it would still be reported as 463% either way with the current setup.
In effect, this current system has a couple of observable downsides with the current AppD setup.
First, if you use these metrics as written against the default node health hardware cpu utilization health rules that live as boilerplate in applications, anything that uses more than 1 cpu (and has plenty of headspace in regards to limit) will alert as being too high because those are static thresholds expecting a 0-100 range. If you want to disable those and make custom rules, you could, but this doesn't lend itself to a large number of differing workloads that all have differing limits.
Second, on a similar note, the current setup of a server cpu page in the context of an application node will have a max of 100%, so any value over that will not read. In the example of a 463% cpu utilization would just show up on this page as 100% currently, so even more context to the real situation of resource headroom is lost now.
- Mark as New
- Bookmark
- Subscribe
- Mute
- Subscribe to RSS Feed
- Permalink
- Report Inappropriate Content
06-17-2021 11:24 AM
Hi Stephen,
In order to maintain the existing customers' requirements and preserve the backward compatibility. We Introduce a new CPU metric that can be available in the metric browser for POD level CPU. We can calculate the pod’s this metric as below:
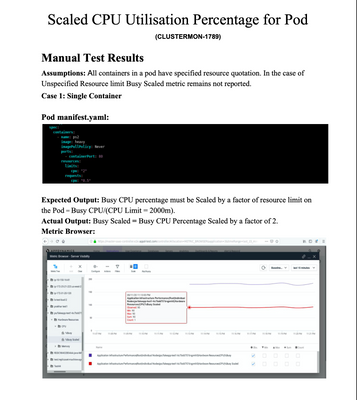
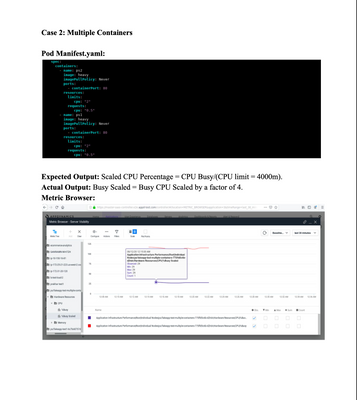
(sum of utilisation of all containers in the pod)/(sum of limits of each container). If a limit is not set for a container, node's cpu will be used as its limit. I have attached some screenshot for this metric "Busy scaled"
The attached screenshots will show you new metric path in the metric browser and an explanation of how this metric is calculated in different scenarios.
Please let me know if this helps.
- Mark as New
- Bookmark
- Subscribe
- Mute
- Subscribe to RSS Feed
- Permalink
- Report Inappropriate Content
06-18-2021 09:38 AM
Hey Abhi,
Thanks for pointing out the scaled metric. This is the calculation that is desirable in regards to a more realistic representation of an individual container's usage.
The question that remains is: Why isn't this more realistic scaled metric used for driving the spark lines from both the container metrics in the pod view of the cluster dashboard, and the server metrics in relation to the node when looking at it from the perspective of an application view?
If the purpose of this metric was for backwards compatibility, wouldn't it make sense to make the "%Busy" metric the scaled value and have a "%Unscaled Busy" metric since this is the new calculation that breaks away from a 0-100% box?
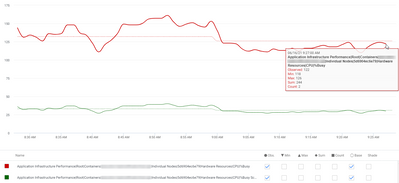
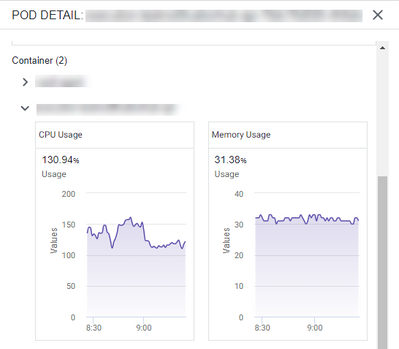
Here is an example from an API that is running showing the metrics you list (in which the scaled one is definitely the desired output) and what shows up under the pod detail for the same container and its related painted metric line within the application node view (the API is instrumented as well). All three of these are from the same 1 hour of metric values.
Metrics as visible from browser for %Busy and %Busy Scaled:
The CPU line shown in context of the pod in the Servers > Clusters > Pods > Pod Detail view:
And finally here is what it looks like in the context of the server cpu usage visualization reporting for the node:
This last one is the most misleading since it just tops out at 100 for the limit on the y axis. When teams look at it from this perspective it is a much more concerning view than what the reality of around ~30% usage with the "%Busy Scaled" metric.
It's also worth noting that the default "CPU utilization is too high" health rule in applications uses the %Busy metric as well. The upswing here is you could change this tho use the relative path of the %Busy Scaled metric instead. Assuming everything in the application is running in a container and has this metric, that is a workable solution.
While you can change this health rule or create others, the visualizations listed above do not offer this option.
With all this said, out of curiosity, is there a reason that a percentage over 100% would be more desirable when displaying cpu usage at the container level? Traditionally in cpu perf monitoring at large, values over 100% could easily arise with multi core cpus and would be scaled in relation to available cores to provide the value in 0-100%. Why the change of outlook for Kubernetes specifically in regards to the default %Busy metric?
- Mark as New
- Bookmark
- Subscribe
- Mute
- Subscribe to RSS Feed
- Permalink
- Report Inappropriate Content
01-05-2025 10:25 AM
- Mark as New
- Bookmark
- Subscribe
- Mute
- Subscribe to RSS Feed
- Permalink
- Report Inappropriate Content
01-13-2025 10:34 AM
Hi Yash
- Obs (observed value): Average of all data points seen for that interval. For a cluster or a time rollup, this represents the weighted average across nodes or over time.
- Min: Minimum data point value seen for that interval.
- Max: Maximum data point value seen for that interval.
- Sum: Sum of all data point values seen for that interval. For the Percentile Metric for the App Agent for Java, this is the result of the percentile value multiplied by the Count.
- Count: Number of data points generated for the metric in that interval. The collection interval for infrastructure metrics varies by environment.
Remember if you wish immediate response, It's better to file a Support ticket with Splunk AppD Support team.
Learn how Splunk and AppDynamics are redefining observability
Watch Now!
Dive into our Community Blog for the Latest Insights and Updates!
Read the blog here

Thank you! Your submission has been received!
Thank you! Your submission has been received!
Oops! Something went wrong while submitting the form


