- Community Hub
- Forum Q&A
- Business iQ (Analytics)
- Controller (SaaS, On Premise)
- Dashboards
- Dynamic Languages (Node.JS, Python, PHP, C/C++, Webserver Agent)
- End User Monitoring (EUM)
- Infrastructure (Server, Network, Database)
- Java (Java Agent, Installation, JVM, and Controller Installation)
- Licensing (including Trial)
- .NET (Agent, Installation)
- Smart Agent
- General Discussions
- Resources
- Groups
- Idea Exchange
Not a customer? Click the 'Start a free trial' link to begin a 30-day SaaS trial of our product and to join our community.
Existing Cisco AppDynamics customers should click the 'Sign In' button to authenticate to access the community
- Cisco AppDynamics Community
- Forums Q&A
- Dynamic Languages
- AppD node js agent unable to communicate with cont...
- Subscribe to RSS Feed
- Mark Topic as New
- Mark Topic as Read
- Float this Topic for Current User
- Bookmark
- Subscribe
- Mute
- Printer Friendly Page
AppD node js agent unable to communicate with controller .
- Mark as New
- Bookmark
- Subscribe
- Mute
- Subscribe to RSS Feed
- Permalink
- Report Inappropriate Content
11-30-2018 10:45 AM - edited 11-30-2018 01:58 PM
Hi,
We are trying to set up App D node JS agent for our front-end Node JS Application hosted on Cloud Foundry.
steps followed -
- declared the dependencies for the NodeJS agent In the package.json file of the application.
"dependencies": {
"appdynamics": "4.5.7",
---
---
}
- Statement require("appdynamics").profile({}) added in the src/app.js file .
- created a user provided service in cloud foundry using cf create-user-provided-service <service name> -p "host-name,port,ssl-enabled,account-name,account-access-key,application-name,tier-name,node-name"
- bind the newly created servcie to our app hosted on cloud foundry .
- setup proxy in cloud foundry usinf cf set-env http_proxy http://user@password:myproxy....:8080/
- restage the app usign cf restage <app-name>
I am still facing issues as my app doesn't gets detected in the AppD controller, I am not sure what is the issue? any thoughts?
Regards,
Surya.
- Mark as New
- Bookmark
- Subscribe
- Mute
- Subscribe to RSS Feed
- Permalink
- Report Inappropriate Content
12-04-2018 09:31 AM
Hi @Anonymous
Thank you for posting your query on the AppDynamics Community.
The issue could be with your proxy setting. Please refer to Node.js Settings Reference and see if you can correct them.
Also, please share the log message (after redacting sensitive information, such as IP) for closer scrutiny.
Hope it helps.
- Mark as New
- Bookmark
- Subscribe
- Mute
- Subscribe to RSS Feed
- Permalink
- Report Inappropriate Content
12-04-2018 10:20 AM
Hi Surya
Are you able to ssh into the container and check the logs at /tmp/appd? They may not exist if the agent didn't start up correctly.
Since a proxy is required, you'd want to use the Node.js agent specific settings (proxyHost, proxyPort), which you'd set in the require statement (see example below). Doc link: https://docs.appdynamics.com/display/PRO45/Node.js+Settings+Reference
Also, you'll want to explicitly set the other AppD settings from your user provided service in the require statement. The example below is based on a marketplace service and environment variables for app and tier name, so you'll have to adapt it to pull the values from the user provided service (based on how it's stored in VCAP_SERVICES). There some more info here:
https://github.com/cloudfoundry-community/node-cfenv
Add as dependency:
"cfenv": "latest",
Also note that nodeName is set to explicitly append the instance id to guarantee a unique node name when you scale and libagent:true will enable the embedded/proxyless agent.
var cfEnv = require('cfenv');var appEnv = cfEnv.getAppEnv();var appdService = appEnv.getServiceCreds('pcf-appd-instance');var appdynamics = require("appdynamics").profile({ controllerHostName: appdService['host-name'], controllerPort: appdService['port'], controllerSslEnabled: appdService['ssl-enabled'], accountName: appdService['account-name'], accountAccessKey: appdService['account-access-key'], applicationName: `${process.env.APPD_APP_NAME}`, tierName: `${process.env.APPD_TIER_NAME}`, nodeName: `${appEnv.name}.${process.env.CF_INSTANCE_INDEX}`, libagent: true, proxyHost: x, proxyPort: y});- Mark as New
- Bookmark
- Subscribe
- Mute
- Subscribe to RSS Feed
- Permalink
- Report Inappropriate Content
12-09-2018 08:39 PM - edited 12-09-2018 08:42 PM
Hi all,
Thanks for reverting, I checked the proxy settings and I am able to connect from my CF environment to App D controller and I tried to log in to the cf app instance.
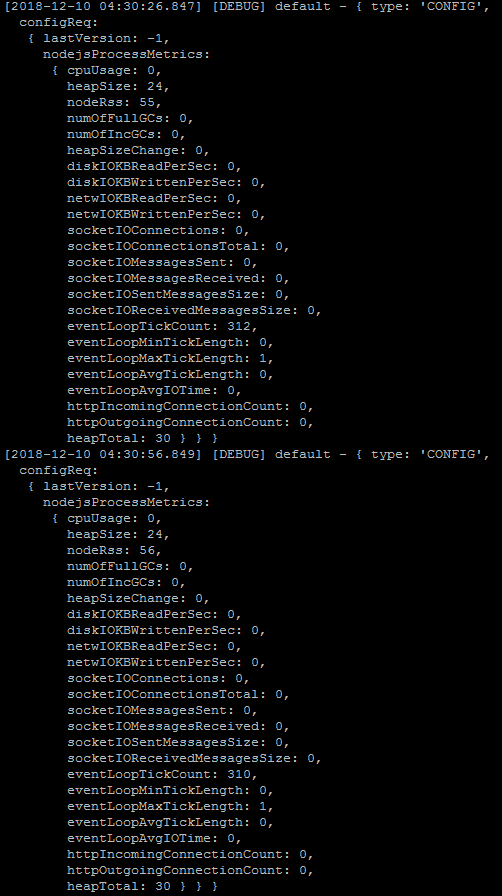
below is the snapshot of the web-sdk-sample-generic#58_$CF_INSTANCE_INDEX-0.json file(snapshpt 2), I had already mentioned all the AppD configuration details in the Cloud foundry using user provided service (CUPS) and binded with my app, but still some parameters are displaying null values.
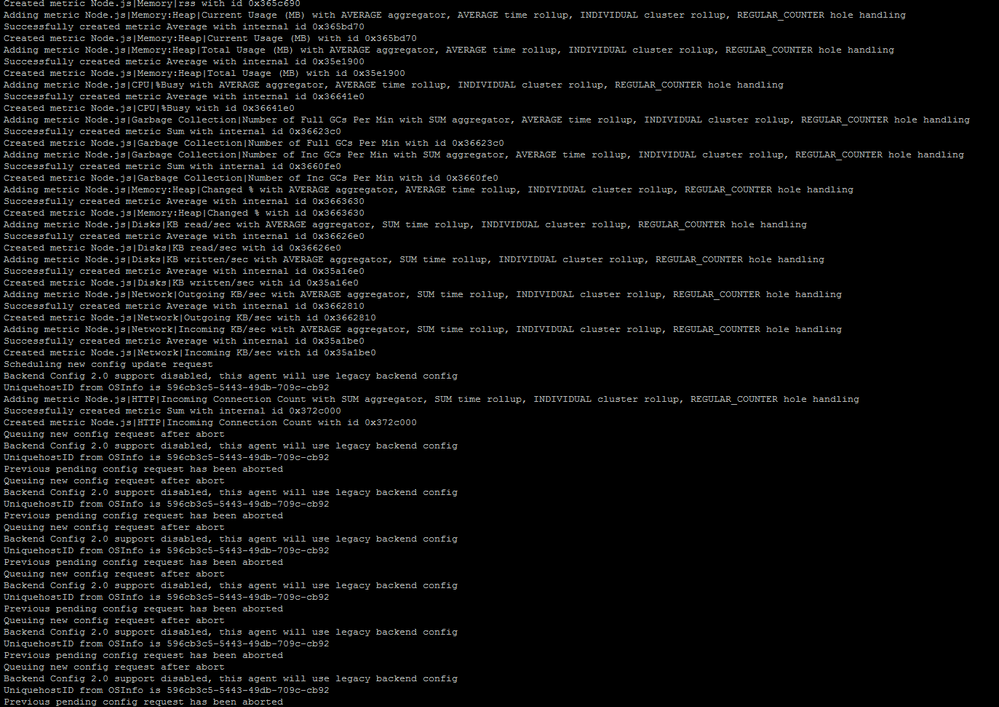
below is the snapshot for agent logs
- Mark as New
- Bookmark
- Subscribe
- Mute
- Subscribe to RSS Feed
- Permalink
- Report Inappropriate Content
12-10-2018 10:30 AM
Hi Surya
Based on the existence of a 'proxy' directory in your app folder:
it doesn't appear the libagent: true flag is set to avoid creating the legacy java proxy, which will spin up a JVM in the container that connects with the controller. Using this flag, the embedded node.js agent will run and connect directly to the controller w/o need for a seperate java proxy.
You can refer to this sample app and try running it in your environment:
https://github.com/Appdynamics/cloudfoundry-apps/blob/master/cf-nodejs/server.js
Also, I see that ${process.env.CF_INSTANCE_INDEX} is not being substituted correctly. After setting the libagent flag to true, can you add console.log statements to print out the values to confirm they're correct. You should see the container index substituted.
For example...
var appdynamics = require("appdynamics").profile({
controllerHostName: appdService['host-name'],
controllerPort: appdService['port'],
controllerSslEnabled: appdService['ssl-enabled'],
accountName: appdService['account-name'],
accountAccessKey: appdService['account-access-key'],
nodeName: `${appEnv.name}.${process.env.CF_INSTANCE_INDEX}`,
libagent: true
});
console.log('host : ' + appdService['host-name'])
console.log('port : ' + appdService['port'])
console.log('ssl: ' + appdService['ssl-enabled'])
console.log('account: ' + appdService['account-name'])
console.log('node : ' + `${appEnv.name}.${process.env.CF_INSTANCE_INDEX}`)
prints out:
2018-12-10T10:21:44.31-0800 [APP/PROC/WEB/0] OUT host : ...appdynamics.com
2018-12-10T10:21:44.32-0800 [APP/PROC/WEB/0] OUT port : 80
2018-12-10T10:21:44.32-0800 [APP/PROC/WEB/0] OUT ssl: false
2018-12-10T10:21:44.32-0800 [APP/PROC/WEB/0] OUT account: customer1
2018-12-10T10:21:44.32-0800 [APP/PROC/WEB/0] OUT node : appd-node-demo.0
Please post the output from these log statements, as well as the agent logs.
- Mark as New
- Bookmark
- Subscribe
- Mute
- Subscribe to RSS Feed
- Permalink
- Report Inappropriate Content
12-10-2018 11:43 AM
Also please include your complete require('appdynamics'){...} statement
- Mark as New
- Bookmark
- Subscribe
- Mute
- Subscribe to RSS Feed
- Permalink
- Report Inappropriate Content
12-10-2018 01:09 PM
Hi Jeffrey,
Please find the latest logs, and the thing is I am able to see my app in the AppD controller for a while with agent status as 30 %, and after a while, even the traffic is being generated the agent status showing 0 %.
Please find the complete logs
- Mark as New
- Bookmark
- Subscribe
- Mute
- Subscribe to RSS Feed
- Permalink
- Report Inappropriate Content
12-10-2018 01:31 PM
Hi Surya
Can you open a support ticket and reference this post?
Jeff
- Mark as New
- Bookmark
- Subscribe
- Mute
- Subscribe to RSS Feed
- Permalink
- Report Inappropriate Content
01-02-2019 12:21 PM
Hi Jeff,
I am able to connect my Node JS AppD agent to the controller and able to see the metrics on the AppD controller dashboard, the thing is we are deploying our application on cf(cloud foundry) and we have 5 instances running in cloud foundry, but we have our AppD monitoring enabled for only one instance , .ie there is the only node is being displayed on the controller, how to spin up a total of 5 nodes in the controller to monitor our instances .
below is the code in the app<server.js file
require("appdynamics").profile({
controllerHostName: 'xyz.saas.appdynamics.com',
controllerPort: 443,
controllerSslEnabled: true,
accountName: 'sample-low',
accountAccessKey: '1234',
tierName: 'web-stg',
nodeName: 'web-stg-1',
applicationName: 'AIQ-STG',
libagent: true,
debug: true
});
and i have created a user provided servcie in cf and binded it to my app in cf .
everything is working fine, but I am unable to figure out spinning additional nodes in AppD for remaining instances in cf.
Please share your thoughts regarding this scenario.
Regards,
Surya Rayala.
Join us on Feb 26 to explore Splunk AppDynamics deployment strategies, SaaS models, agent rollout plans, and expert best practices.
Register Now
Dive into our Community Blog for the Latest Insights and Updates!
Read the blog here
- Unable to get AppAgentConfigurationResponse from controller in Controller (SaaS, On Premises)
- Login issue. in Controller (SaaS, On Premises)
- Unable to install controller on windows in Controller (SaaS, On Premises)
- Getting error post installing Linux Monitoring Extension to monitor NFS in Infrastructure (Server, Network, Database)
- Need Assistance Resolving Error in AppDynamics Controller in Controller (SaaS, On Premises)

Thank you! Your submission has been received!
Thank you! Your submission has been received!
Oops! Something went wrong while submitting the form


