- Community Hub
- Forum Q&A
- Business iQ (Analytics)
- Cisco Cloud Observability
- Controller (SaaS, On Premise)
- Dashboards
- Dynamic Languages (Node.JS, Python, PHP, C/C++, Webserver Agent)
- End User Monitoring (EUM)
- Infrastructure (Server, Network, Database)
- Java (Java Agent, Installation, JVM, and Controller Installation)
- Licensing (including Trial)
- .NET (Agent, Installation)
- Privacy and Security
- Smart Agent
- General Discussions
- Resources
- Groups
- Idea Exchange
Not a customer?
Start a free trial
Not a customer? Click the 'Start a free trial' link to begin a 30-day SaaS trial of our product and to join our community.
Existing Cisco AppDynamics customers should click the 'Sign In' button to authenticate to access the community
Turn on suggestions
Auto-suggest helps you quickly narrow down your search results by suggesting possible matches as you type.
- Cisco AppDynamics Community
- Forums Q&A
- Dashboards
- Re: Is there a possibility to create tables in das...
Options
- Subscribe to RSS Feed
- Mark Topic as New
- Mark Topic as Read
- Float this Topic for Current User
- Bookmark
- Subscribe
- Mute
- Printer Friendly Page
Is there a possibility to create tables in dashboard
Options
- Mark as New
- Bookmark
- Subscribe
- Mute
- Subscribe to RSS Feed
- Permalink
- Report Inappropriate Content
06-12-2017 05:14 AM - last edited on 11-22-2019 02:14 PM by Ryan.Paredez
Can anyone please let me know if we can create table form metrics in dashboard?
When checked in custom widgets there is an option for table format but there I am not getting the parameters that I want to select.
We are looking for response time, CPU, memory, etc on one axis and on timelines on the other axis.
6 REPLIES 6
Options
- Mark as New
- Bookmark
- Subscribe
- Mute
- Subscribe to RSS Feed
- Permalink
- Report Inappropriate Content
06-13-2017 07:21 AM
Currently you can configure Tables to display the results of Business iQ (ADQL) queries on the Analytics (Events Service) data, but not metrics.
You can produce CSV reports for metrics in tabular format using REST API queries.
When you say you're looking for "response time, cpu,memory etc on one axis and on time lines on the other axis", what are the rows and what are the columns?
Regards,
Brian Wheeldon
Brian Wheeldon, Solution Engineer, NYC
Found something helpful? Click the Accept as Solution button to help others find answers faster.
Liked something? Click the Thumbs Up button.
Options
- Mark as New
- Bookmark
- Subscribe
- Mute
- Subscribe to RSS Feed
- Permalink
- Report Inappropriate Content
06-13-2017 07:32 AM
Thank you Brian for you reply.
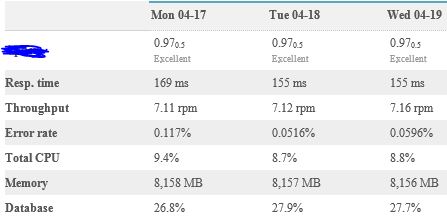
I am looking for columns such as response time, cpu, memory etc and rows need various time lines .Attached the sample view.
Please let me know whether it is possible and how can we configiure that
Sample.JPG
23 KB
Options
- Mark as New
- Bookmark
- Subscribe
- Mute
- Subscribe to RSS Feed
- Permalink
- Report Inappropriate Content
06-13-2017 08:01 AM
Thanks for the clarification and sample.
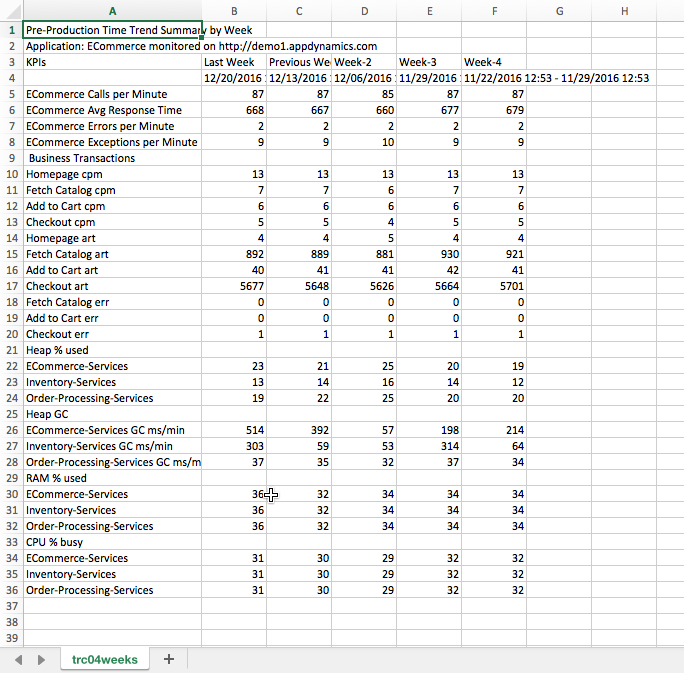
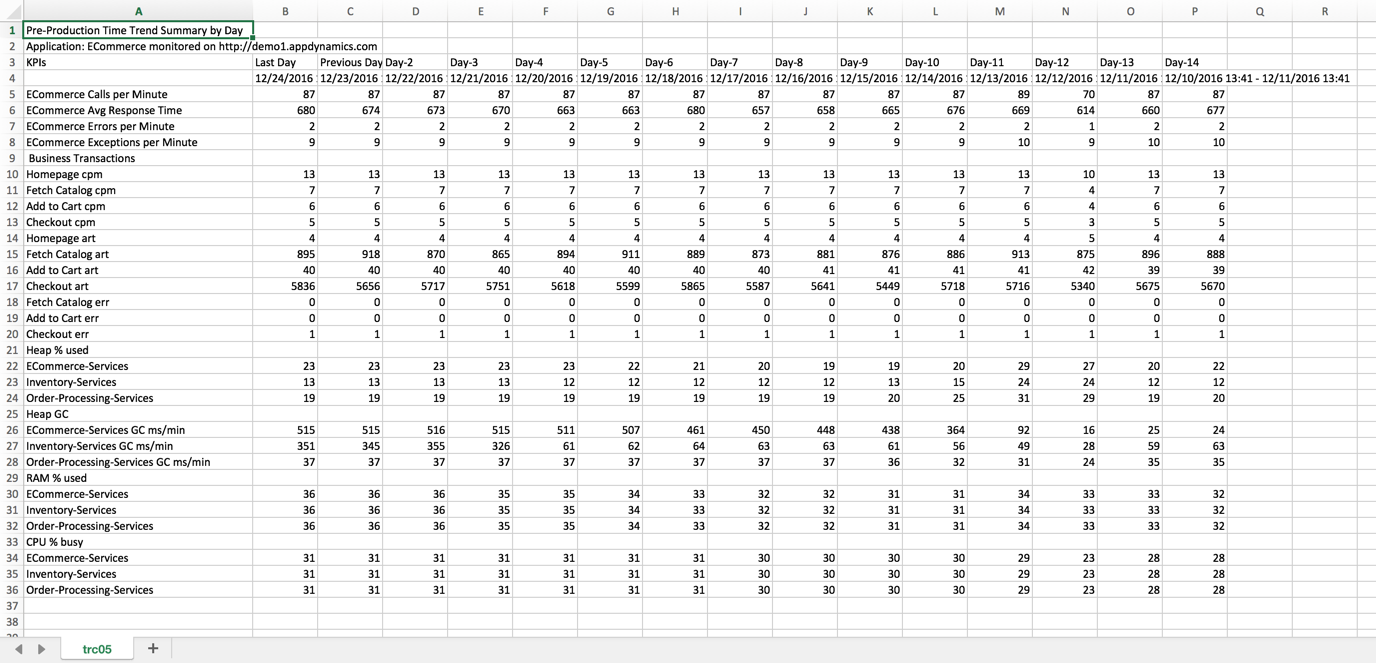
Here's a similar CSV report built using the REST API:
Time Chunk Comparison: Current time period vs. previous time periods for a configurable set of key metrics
For the rows, specify a set of labels with associated Metric Path
For the columns, specify the time delta, "Week", with the number of ms in that period, plus the number of weeks to compare (e.g. 4)
With three un-comments/comments, convert this to a daily report comparing the previous 14 days
Reports like these can be created using any number of ways using the REST API, but the approach I found simplest is to install two pre-requisites on a box with a JRE and network access to your Controller:
2. Groovy script to produce the CSV
Send me your output of `groovy -version` and I'll share the script I used to generate the reports above.
Regards,
Brian Wheeldon
Brian Wheeldon, Solution Engineer, NYC
Found something helpful? Click the Accept as Solution button to help others find answers faster.
Liked something? Click the Thumbs Up button.
Options
- Mark as New
- Bookmark
- Subscribe
- Mute
- Subscribe to RSS Feed
- Permalink
- Report Inappropriate Content
04-12-2018 04:56 AM
I was creating similar report folowwing the this guidance. But the images seem to be broken. Can you reshare the same?
Options
- Mark as New
- Bookmark
- Subscribe
- Mute
- Subscribe to RSS Feed
- Permalink
- Report Inappropriate Content
04-12-2018 05:20 AM
Added these images as attachments.
Brian Wheeldon, Solution Engineer, NYC
Found something helpful? Click the Accept as Solution button to help others find answers faster.
Liked something? Click the Thumbs Up button.
Options
- Mark as New
- Bookmark
- Subscribe
- Mute
- Subscribe to RSS Feed
- Permalink
- Report Inappropriate Content
11-01-2021 09:02 AM - last edited on 11-02-2021 10:07 AM by Ryan.Paredez
I need to create a dashboard for all applications with APP agent, machine agent, business transaction health in a table as shown in the attachment. I had created a dashboard with the widgets for an application in that I can see the agent status but I want it in a table. I cannot find the table in the widgets.
could you please help me know how to do this?
with regards
charan.

Learn how Splunk and AppDynamics are redefining observability
Register Now!
Dive into our Community Blog for the Latest Insights and Updates!
Read the blog here
Related Content
- Dashboard table widget with Top 10 of a custom metrics in Dashboards
- Anyway to show Baseline metrics with an Analytics search within a Dashboard table? in Business iQ (Analytics)
- Node / Metric Limit Monitoring in Controller (SaaS, On Premises)
- Controller only gets part of the data from machine agent, most metrics are missing in Infrastructure (Server, Network, Database)
- AppDynamic Database connecting to Power BI via an API to obtain real-time data for visualisations in Infrastructure (Server, Network, Database)
Thank you! Your submission has been received!
Thank you! Your submission has been received!
Oops! Something went wrong while submitting the form
By clicking subscribe, I have read and understood the Privacy Policy and Terms of Use.