- Community Hub
- Forum Q&A
- Business iQ (Analytics)
- Controller (SaaS, On Premise)
- Dashboards
- Dynamic Languages (Node.JS, Python, PHP, C/C++, Webserver Agent)
- End User Monitoring (EUM)
- Infrastructure (Server, Network, Database)
- Java (Java Agent, Installation, JVM, and Controller Installation)
- Licensing (including Trial)
- .NET (Agent, Installation)
- Smart Agent
- General Discussions
- Resources
- Groups
- Idea Exchange
Not a customer? Click the 'Start a free trial' link to begin a 30-day SaaS trial of our product and to join our community.
Existing Cisco AppDynamics customers should click the 'Sign In' button to authenticate to access the community
- Cisco AppDynamics Community
- Forums Q&A
- Dashboards
- Consolidated Dashboard Creation
- Subscribe to RSS Feed
- Mark Topic as New
- Mark Topic as Read
- Float this Topic for Current User
- Bookmark
- Subscribe
- Mute
- Printer Friendly Page
- Mark as New
- Bookmark
- Subscribe
- Mute
- Subscribe to RSS Feed
- Permalink
- Report Inappropriate Content
01-23-2017 02:15 AM - last edited on 11-22-2019 03:17 PM by Ryan.Paredez
Hello All,
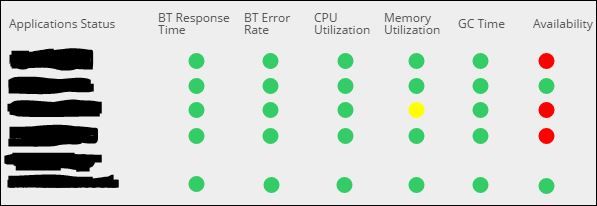
I am new to AppDynamics, here i am seeking guidance for creation of Consolidated Dashboard for approx 15-20 application server in that with information of each application wtih respect to Business Transation Response Time, BT Error Rate, CPU Utilization and Memory Utilization, App Availability etc...
It should be look like:::: Please refer the below Screenshot
Thanks in Advance...
Shirish.
Solved! Go to Solution.
- Mark as New
- Bookmark
- Subscribe
- Mute
- Subscribe to RSS Feed
- Permalink
- Report Inappropriate Content
01-25-2017 05:50 AM
Are you looking for this JSON template to import or advices on how to build
the KPI you mentioned?
- Mark as New
- Bookmark
- Subscribe
- Mute
- Subscribe to RSS Feed
- Permalink
- Report Inappropriate Content
01-26-2017 10:18 PM
Hello JB,
Thanks for your reply, well i have done this now, with self learning... with Import - Export and JSON modification and configuration etc.
Cheers,
Shirish.
- Mark as New
- Bookmark
- Subscribe
- Mute
- Subscribe to RSS Feed
- Permalink
- Report Inappropriate Content
01-30-2017 10:53 AM
we done the similar dashboard.
- Mark as New
- Bookmark
- Subscribe
- Mute
- Subscribe to RSS Feed
- Permalink
- Report Inappropriate Content
02-13-2017 08:10 AM
Hi,
I can see a status ligh with the Availability.
How you get this metric?
Thanks in advance.
Pablo.
- Mark as New
- Bookmark
- Subscribe
- Mute
- Subscribe to RSS Feed
- Permalink
- Report Inappropriate Content
02-14-2017 10:05 PM
By Positioning the icons and labels in edit mode. you can make such metrics.
Thanks.
Shirish.
- Mark as New
- Bookmark
- Subscribe
- Mute
- Subscribe to RSS Feed
- Permalink
- Report Inappropriate Content
10-12-2017 04:11 AM
Is there a JSON that can be shared ?
Join us on Feb 26 to explore Splunk AppDynamics deployment strategies, SaaS models, agent rollout plans, and expert best practices.
Register Now
Dive into our Community Blog for the Latest Insights and Updates!
Read the blog here

Thank you! Your submission has been received!
Thank you! Your submission has been received!
Oops! Something went wrong while submitting the form
