- Community Hub
- Forum Q&A
- Business iQ (Analytics)
- Controller (SaaS, On Premise)
- Dashboards
- Dynamic Languages (Node.JS, Python, PHP, C/C++, Webserver Agent)
- End User Monitoring (EUM)
- Infrastructure (Server, Network, Database)
- Java (Java Agent, Installation, JVM, and Controller Installation)
- Licensing (including Trial)
- .NET (Agent, Installation)
- Smart Agent
- General Discussions
- Resources
- Groups
- Idea Exchange
Not a customer? Click the 'Start a free trial' link to begin a 30-day SaaS trial of our product and to join our community.
Existing Cisco AppDynamics customers should click the 'Sign In' button to authenticate to access the community
- Cisco AppDynamics Community
- Forums Q&A
- Controller
- Cannot add DB performance metric in "Metric Value"...
- Subscribe to RSS Feed
- Mark Topic as New
- Mark Topic as Read
- Float this Topic for Current User
- Bookmark
- Subscribe
- Mute
- Printer Friendly Page
At 6pm PST, the AppDynamics Community will go into read-only mode and after migration is complete, you will be redirected to community.splunk.com.
Read more here
Cannot add DB performance metric in "Metric Value" widget of dashboard
- Mark as New
- Bookmark
- Subscribe
- Mute
- Subscribe to RSS Feed
- Permalink
- Report Inappropriate Content
04-11-2018 08:58 PM
Good Morning All,
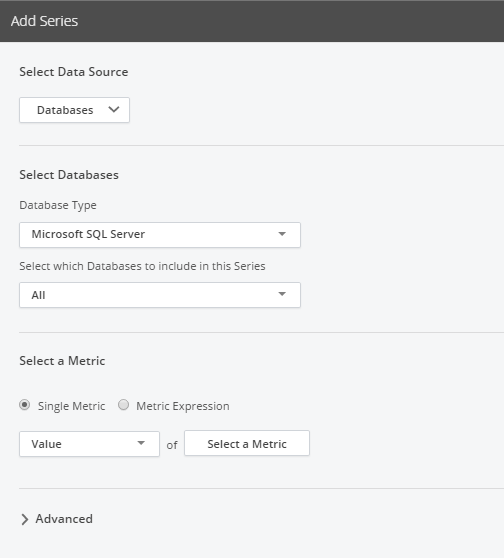
I want to create a dashboard to represent values of some DB performance metrics which are available in the metric browser. When I chose "Metric Value" widget, I don't see "Performance" metric group listed to add as a metric to display but the same is available in the metric browser. The only metric groups available in "Metric Value" widget are, "Custom Metric, Hardware Resources, and KPI". But when I chose a different widget type e.g. "Timeseries Graph", the "Performance" metric group is available to use.
The exact metric which I want to represent using metric value widget, in this case, is "Buffer Cache Hit Ratio" and its full path is, "Databases|CISM-PROD-ARRPRD|Performance|Buffer Cache Hit Ratio"
Can anyone please explain the reason behind it?
Please see attached screenshots for reference.
Regards,
Mukesh Singh
- Mark as New
- Bookmark
- Subscribe
- Mute
- Subscribe to RSS Feed
- Permalink
- Report Inappropriate Content
07-27-2018 03:19 AM
You should not select Database Type as "All". Select the correct DB. In my case its "Micorsoft SQL server". If you select "All" it wont dispaly only the common KPIs
Join us on Feb 26 to explore Splunk AppDynamics deployment strategies, SaaS models, agent rollout plans, and expert best practices.
Register Now
Dive into our Community Blog for the Latest Insights and Updates!
Read the blog here
- Is there a REST API for returning a dashboard's share URL? in Dashboards
- MRUM Session Replay Preview - Now Live! in End User Monitoring (EUM)
- Misatched counts in metric browser in Java (Java Agent, Installation, JVM, and Controller Installation)
- Availability Trend for a dashboard / Availability Trend para un dashboard in Dashboards
- Restore deleted custom dashboard in End User Monitoring (EUM)
| User | Count |
|---|---|
| 1 | |
| 1 | |
| 1 | |
| 1 | |
| 1 | |
| 1 |

Thank you! Your submission has been received!
Thank you! Your submission has been received!
Oops! Something went wrong while submitting the form
