- Community Hub
- Forum Q&A
- Business iQ (Analytics)
- Controller (SaaS, On Premise)
- Dashboards
- Dynamic Languages (Node.JS, Python, PHP, C/C++, Webserver Agent)
- End User Monitoring (EUM)
- Infrastructure (Server, Network, Database)
- Java (Java Agent, Installation, JVM, and Controller Installation)
- Licensing (including Trial)
- .NET (Agent, Installation)
- Privacy and Security
- Smart Agent
- General Discussions
- Resources
- Groups
- Idea Exchange
Not a customer? Click the 'Start a free trial' link to begin a 30-day SaaS trial of our product and to join our community.
Existing Cisco AppDynamics customers should click the 'Sign In' button to authenticate to access the community
- Cisco AppDynamics Community
- Resources
- Knowledge Base
- Streamlining Java Application Observability in Kub...
- Subscribe to RSS Feed
- Mark as New
- Mark as Read
- Bookmark
- Subscribe
- Printer Friendly Page
- Report Inappropriate Content
- Article History
- Subscribe to RSS Feed
- Mark as New
- Mark as Read
- Bookmark
- Subscribe
- Printer Friendly Page
- Report Inappropriate Content
on 04-10-2024 04:08 PM
The integration of OpenTelemetry Java agents into your application’s Docker containers represents a significant leap towards enhanced observability and monitoring capabilities. This guide details how to embed the OpenTelemetry Java Agent into your Dockerfile for a Java application, deploy it on Kubernetes, and monitor its traces using Cisco AppDynamics, thereby providing a robust solution for real-time application performance monitoring.
Pre-requisites
Ensure you have the following set up and ready:
- A Kubernetes cluster
- Docker and Kubernetes command-line tools,
dockerandkubectl, installed and configured - Access to an AppDynamics account for monitoring
1. Preparing Your Dockerfile for Observability
The Dockerfile outlined integrates the OpenTelemetry Java agent into a Tomcat server to enable automated instrumentation of your Java application.
FROM tomcat:latest
RUN apt-get update -y && apt-get -y install wget
RUN apt-get install -y curl
ADD sample.war /usr/local/tomcat/webapps/
ADD https://github.com/open-telemetry/opentelemetry-java-instrumentation/releases/latest/download/opentelemetry-javaagent.jar /tmp
ENV JAVA_OPTS="-javaagent:/tmp/opentelemetry-javaagent.jar -Dappdynamics.opentelemetry.enabled=true -Dotel.resource.attributes="service.name=tomcatOtelJavaK8s,service.namespace=tomcatOtelJavaK8s""
ENV OTEL_EXPORTER_OTLP_ENDPOINT=http://appdynamics-collectors-ds-appdynamics-otel-collector.cco.svc.cluster.local:4318
CMD ["catalina.sh","run"]
- Base Image: Start with
tomcat:latestas the base image for deploying a Java web application. - Installing Utilities: Update the package list and install necessary utilities like
wgetandcurlfor downloading the OpenTelemetry Java agent. - Adding Your Application: Use the
ADDcommand to place your.warfile in thewebappsdirectory of Tomcat. - Integrating OpenTelemetry: Download the latest OpenTelemetry Java agent using
ADDcommand and setJAVA_OPTSto include the path to the downloaded agent, enabling specific OpenTelemetry configurations. - Environment Variables: Define
OTEL_EXPORTER_OTLP_ENDPOINTto specify the endpoint of the AppDynamics OTel Collector or your custom otel collector, which will process and forward your telemetry data to AppDynamics.
2. Deploying Your Application on Kubernetes
Your deployment YAML file configures Kubernetes to deploy your containerized application, exposing it through a service for external access.
---
apiVersion: apps/v1
kind: Deployment
metadata:
  name: java-app-with-otel-agent
  labels:
    app: java-app-with-otel-agent
  namespace: appd-cloud-apps
spec:
  replicas: 1
  selector:
    matchLabels:
      app: java-app-with-otel-agent
  template:
    metadata:
      labels:
        app: java-app-with-otel-agent
    spec:
      containers:
      - name: java-app-with-otel-agent
        image: docker.io/abhimanyubajaj98/java-app-with-otel-agent
        imagePullPolicy: Always
        ports:
        - containerPort: 8080
---
apiVersion: v1
kind: Service
metadata:
  name: java-app-with-otel-agent
  labels:
    app: java-app-with-otel-agent
  namespace: appd-cloud-apps
spec:
  ports:
  - port: 8080
    targetPort: 8080
  selector:
    app: java-app-with-otel-agent
- Deployment Configuration: Define a deployment in Kubernetes to manage your application’s replicas, ensuring it’s set to match your application’s requirements.
- Service Exposure: Create a Kubernetes service to expose your application on a specified port, allowing traffic to reach your application.
3. Setting Up the AppDynamics Otel Collector
To monitor your application’s traces in Cisco AppDynamics, deploy the AppDynamics Otel Collector within your Kubernetes cluster. This collector processes traces from your application and sends them to AppDynamics.
- Collector Configuration: Use the official documentation to deploy the AppDynamics Otel Collector, ensuring it’s correctly configured to receive telemetry data from your application.
https://docs.appdynamics.com/observability/cisco-cloud-observability/en/kubernetes-and-app-service-m... - Service Discovery: Ensure your application’s deployment is configured to send traces to the collector service, typically through environment variables or configuration files.
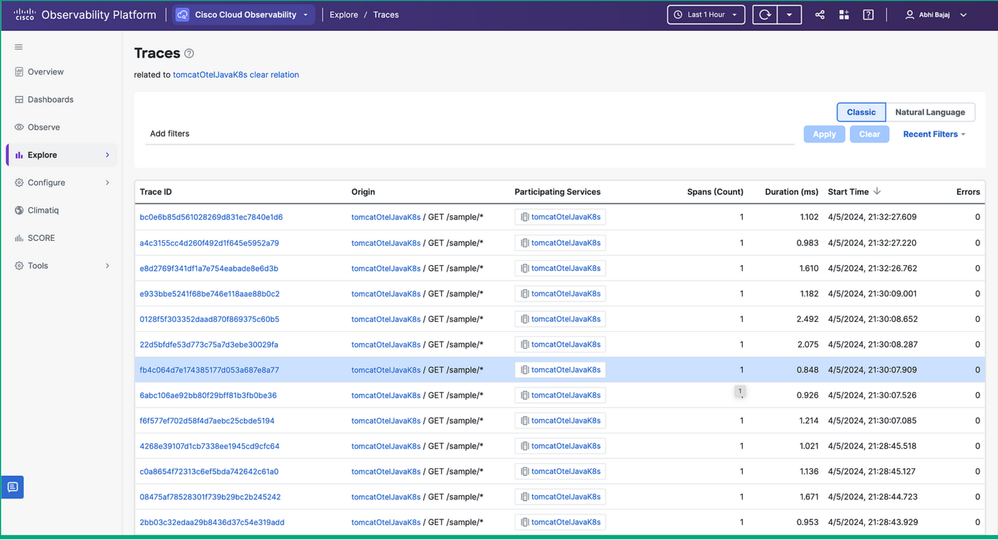
4. Monitoring Traces in AppDynamics
To produce a load for our Sample App, Exec inside the pod and run
curl -v http://localhost:8080/sample/
With your application deployed and the Otel Collector set up, you can now monitor your application’s performance in AppDynamics.
- Accessing AppDynamics: Log into your AppDynamics dashboard.
- Viewing Traces: Navigate to the tracing or application monitoring section to view the traces sent from your Kubernetes-deployed application, allowing you to monitor requests, response times, and error rates.
Conclusion
Integrating the OpenTelemetry Java agent into your Java application’s Dockerfile and deploying it on Kubernetes offers a seamless path to observability. By leveraging Cisco AppDynamics in conjunction with this setup, you gain powerful insights into your application’s performance, helping you diagnose and resolve issues more efficiently. This guide serves as a starting point for developers looking to enhance their application’s observability in a Kubernetes environment.
Learn how Splunk and AppDynamics are redefining observability
Register Now!
Dive into our Community Blog for the Latest Insights and Updates!
Read the blog here

Thank you! Your submission has been received!
Thank you! Your submission has been received!
Oops! Something went wrong while submitting the form
