- Community Hub
- Forum Q&A
- Business iQ (Analytics)
- Controller (SaaS, On Premise)
- Dashboards
- Dynamic Languages (Node.JS, Python, PHP, C/C++, Webserver Agent)
- End User Monitoring (EUM)
- Infrastructure (Server, Network, Database)
- Java (Java Agent, Installation, JVM, and Controller Installation)
- Licensing (including Trial)
- .NET (Agent, Installation)
- Smart Agent
- General Discussions
- Resources
- Groups
- Idea Exchange
Not a customer? Click the 'Start a free trial' link to begin a 30-day SaaS trial of our product and to join our community.
Existing Cisco AppDynamics customers should click the 'Sign In' button to authenticate to access the community
- Cisco AppDynamics Community
- Resources
- Knowledge Base
- Do you have a sample custom dashboard for Browser ...
- Subscribe to RSS Feed
- Mark as New
- Mark as Read
- Bookmark
- Subscribe
- Printer Friendly Page
- Report Inappropriate Content
At 6pm PST, the AppDynamics Community will go into read-only mode and after migration is complete, you will be redirected to community.splunk.com.
Read more here
- Article History
- Subscribe to RSS Feed
- Mark as New
- Mark as Read
- Bookmark
- Subscribe
- Printer Friendly Page
- Report Inappropriate Content
on 06-21-2017 09:40 AM - edited on 10-12-2018 02:21 PM by Nina.Wolinsky
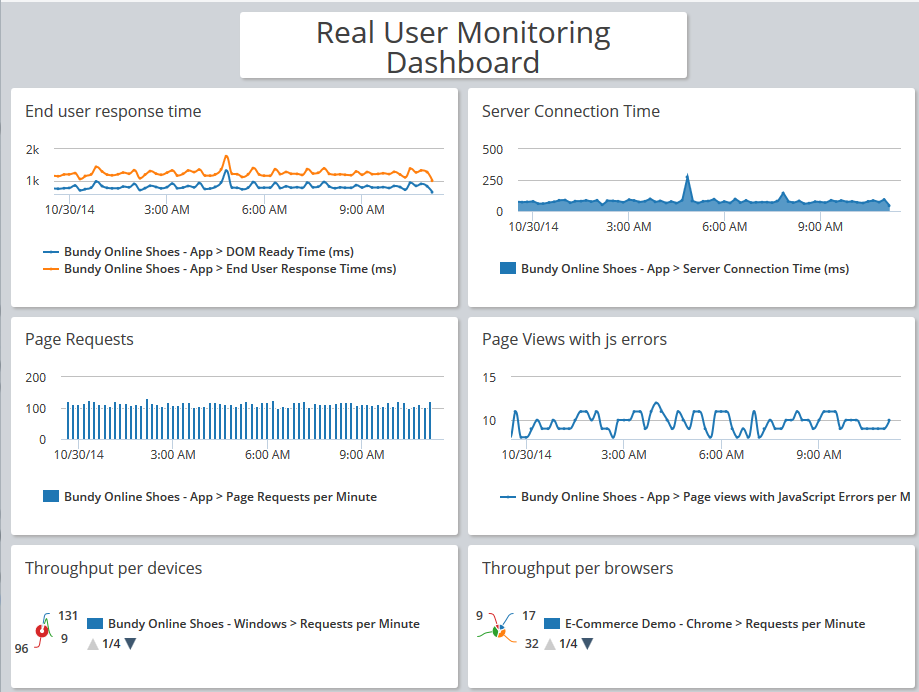
This sample custom dashboard focuses on end user monitoring metrics. It gives you insight into your end user's response time and the throughput and load for your application.
To use this dashboard, import the attached RUM-Dashboard.xml file and follow the instructions to rebind similar metrics appearing in your application.
- Login to your Controller UI (3.9 and higher).
- Navigate to the Custom Dashboards list screen.
- Import the RUM-Dashboard.xml file.
- Rebind the metrics which correspond for your particular application. To do this, you edit each displayed widget in the dashboard, select your application and then confirm or select the metric for that display.
If you need detailed instructions for working with custom dashboard widgets, please visit docs.appdynamics.com and view Create Custom Dashboards.
Want to learn more? Sign up for the Custom Dashboards Best Practices self-paced course through AppDynamics University.
Return to Dashboard Do's and Don'ts.
- Mark as Read
- Mark as New
- Bookmark
- Permalink
- Report Inappropriate Content
Join us on Feb 26 to explore Splunk AppDynamics deployment strategies, SaaS models, agent rollout plans, and expert best practices.
Register Now
Dive into our Community Blog for the Latest Insights and Updates!
Read the blog here

Thank you! Your submission has been received!
Thank you! Your submission has been received!
Oops! Something went wrong while submitting the form
