- Community Hub
- Forum Q&A
- Business iQ (Analytics)
- Controller (SaaS, On Premise)
- Dashboards
- Dynamic Languages (Node.JS, Python, PHP, C/C++, Webserver Agent)
- End User Monitoring (EUM)
- Infrastructure (Server, Network, Database)
- Java (Java Agent, Installation, JVM, and Controller Installation)
- Licensing (including Trial)
- .NET (Agent, Installation)
- Smart Agent
- General Discussions
- Resources
- Groups
- Idea Exchange
Not a customer? Click the 'Start a free trial' link to begin a 30-day SaaS trial of our product and to join our community.
Existing Cisco AppDynamics customers should click the 'Sign In' button to authenticate to access the community
- Cisco AppDynamics Community
- Forums Q&A
- Java
- Re: Tomcat Java Agent - Query Parameters
- Subscribe to RSS Feed
- Mark Topic as New
- Mark Topic as Read
- Float this Topic for Current User
- Bookmark
- Subscribe
- Mute
- Printer Friendly Page
At 6pm PST, the AppDynamics Community will go into read-only mode and after migration is complete, you will be redirected to community.splunk.com.
Read more here
Tomcat Java Agent - Query Parameters
- Mark as New
- Bookmark
- Subscribe
- Mute
- Subscribe to RSS Feed
- Permalink
- Report Inappropriate Content
02-24-2021 03:39 PM
Hi,
Is there a way to send the Query Parameters and possibly the headers to AppDynamics?
Thanks
- Mark as New
- Bookmark
- Subscribe
- Mute
- Subscribe to RSS Feed
- Permalink
- Report Inappropriate Content
02-24-2021 09:55 PM
Hi Wayne
What type of Java application are you referring to?
AppDynamics has the built in capability to collect the Parameters, headers & Cookies using the Data Collector section within the Controller.
This will work for most supported servlets, webservices etc.
Ciao
- Mark as New
- Bookmark
- Subscribe
- Mute
- Subscribe to RSS Feed
- Permalink
- Report Inappropriate Content
02-25-2021 10:24 AM
This is a tomcat server, in the app dynamics console we are seeing the servlet but not the query parameters or headers..
This could just be me not being familiar with AppDynamics, but when I go to:
- Application Dashboard
- Top Business Transactions
- From the By Response Time panel
- double click onthe first item in the list
- then click Slow Response Times
- From the By Response Time panel
- Top Business Transactions
It displays the following columns:
- Time
- Exe Time(ms)
- URL
- Business Transaction
- Tier
- Node
But the URL and business transaction only show the URL and not the query parameters. In our case the query parameters are needed to help determine the actual endpoint.
If I double click on the item on this table to see the detail, I see the stack trace and SQL calls which is great.
So I'm curious if this is as designed or a configuration issue.
Thanks
- Mark as New
- Bookmark
- Subscribe
- Mute
- Subscribe to RSS Feed
- Permalink
- Report Inappropriate Content
02-25-2021 10:01 PM - edited 02-25-2021 10:27 PM
Hi Wayne
If these URL's are using basic URL parameters, you should at least see the full URL's e.g
www.example.com/search?make=civic
A quick way to check is to navigate as follows
From main application Screen, click on the relevant applictaion
> Click on Configuration
>> Click on Instrumentation
>>> Click on Transaction Detection
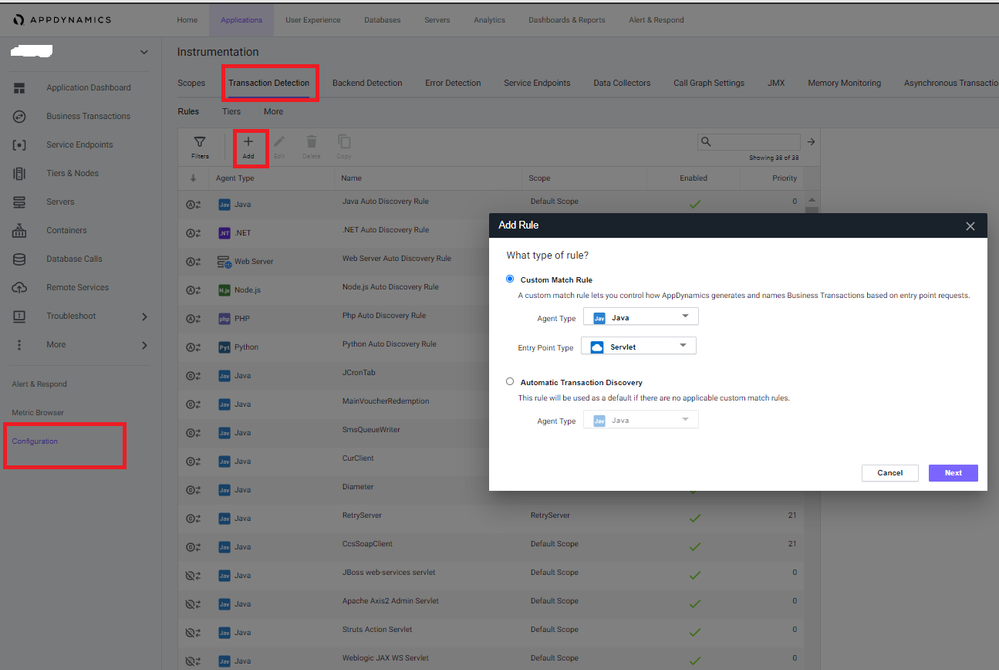
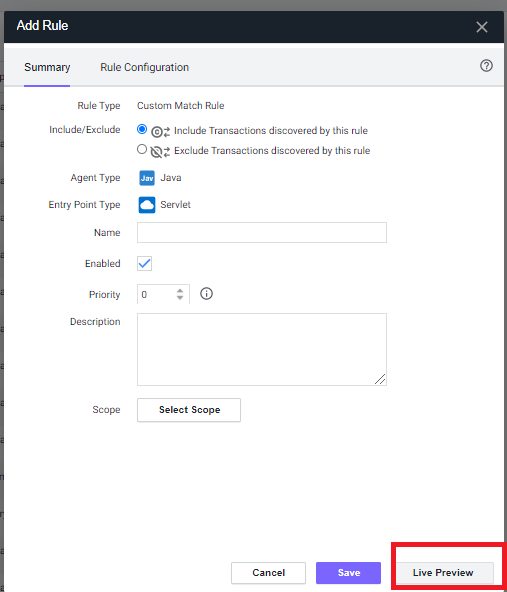
>>>>Click on the "Add +" and click Next and then Live Preview, it will give you an option to select a node, select one which has traffic
Once the screen loads, change the option from "Preview Business Transactions" to "Tools", which will default to "HTTP Requests".
Now just ensure that you can simulate to drive traffic to the application, it will show the incoming URL's being hit, click on them, and on the right it will show the Headers, Cookies and parameters.
If you find the parameters you require you can then use that to do one of 3 things
1. In the Instrumentation > Data collector section add them to be collected in the transaction snapshots.
This will show these values in the collected snapshots when viewing them.
The next option depends on the amount of unique parameters you want to split on. As there is a limit on the number of Business Transactions for every application it's always best practice to rather split the servlets within Service Endpoints for tracking them seperately.
You can go to Instrumentation > Transaction Detection and use the split Transaction using parameter value, or you go to Instrumentation > Service Endpoints and again, split the servlets based on a parameter value
Ciao
- Mark as New
- Bookmark
- Subscribe
- Mute
- Subscribe to RSS Feed
- Permalink
- Report Inappropriate Content
02-28-2021 10:09 PM
Hi Wayne
Normally the parameters would show in the URL section.
The quickest way to check is to run a live preview on the Java Node, using the HTTP Requests section, to view live data coming into the system.
In this view you would be able to see the parameters, cookies & Headers for the live requests. as below
You can then use the Transaction Detection rules or Service Endpoints rules, to split out the transactions according to these parameters. If you wish to view them separately.
If the split according to parameters is more than 150-200, rather split them out in the Service Endpoints section.
Ciao
- Mark as New
- Bookmark
- Subscribe
- Mute
- Subscribe to RSS Feed
- Permalink
- Report Inappropriate Content
03-05-2021 06:17 AM
@Mario.Morelli Ok so silly question.. How to get that via the UI, as can seem to find it
- Mark as New
- Bookmark
- Subscribe
- Mute
- Subscribe to RSS Feed
- Permalink
- Report Inappropriate Content
03-05-2021 06:26 AM
Hi Wayne
No problem:)
You navigate to the application itself then follow these steps
1. Click on Configuration in the bottom left, then > Instrumentation > Transaction Detection.
Click on the Add "+" button as if you are going to create a new rule, and keep the default there for Java & Servlet, click on next and then select a node that has traffic and click live preview.
Once it's running, switch the view from Business Transactions, to HTTP requests, this will show the live endpoints being called in the application, along with the cookies, headers & parameters.
You can then identify if you can see the parameters you require and then create rules to split out the traffic using the params or whichever way you want to visualize the data.
- Mark as New
- Bookmark
- Subscribe
- Mute
- Subscribe to RSS Feed
- Permalink
- Report Inappropriate Content
04-23-2021 06:36 AM
@Mario.Morelli Sorry for the delay.. The information you provided let me see the parameters on the live query..
As you can probably tell I'm new to AppDynamics and taking over something that somebody has configured.
So I have a couple of things I'm trying to resolved:
- Goto Business Transactions
- Pick an item by double clicking
- Go to Transaction snapshots
- Double click on one of the items
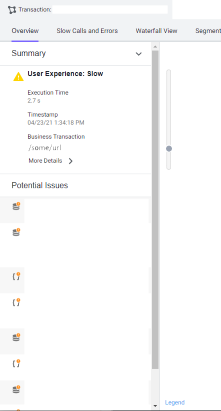
You get a page like this..
- But can't see any parameter passed, so my question is this possible.
- The App I'm trying to get the full path, it would appear to have an unusual path. Which is something along lines of /root/endpoint#/root/action?param1=xxx¶m2=xxxx
- Currently AppDynamics would appear to be truncating when it hits the # so was wondering if there was a way to either get the full path or ability to get the path after the #
Join us on Feb 26 to explore Splunk AppDynamics deployment strategies, SaaS models, agent rollout plans, and expert best practices.
Register Now
Dive into our Community Blog for the Latest Insights and Updates!
Read the blog here

Thank you! Your submission has been received!
Thank you! Your submission has been received!
Oops! Something went wrong while submitting the form


