- Community Hub
- Forum Q&A
- Business iQ (Analytics)
- Controller (SaaS, On Premise)
- Dashboards
- Dynamic Languages (Node.JS, Python, PHP, C/C++, Webserver Agent)
- End User Monitoring (EUM)
- Infrastructure (Server, Network, Database)
- Java (Java Agent, Installation, JVM, and Controller Installation)
- Licensing (including Trial)
- .NET (Agent, Installation)
- Smart Agent
- General Discussions
- Resources
- Groups
- Idea Exchange
Not a customer? Click the 'Start a free trial' link to begin a 30-day SaaS trial of our product and to join our community.
Existing Cisco AppDynamics customers should click the 'Sign In' button to authenticate to access the community
- Cisco AppDynamics Community
- Forums Q&A
- Java
- Tomcat JDBC connection pool monitoring.
- Subscribe to RSS Feed
- Mark Topic as New
- Mark Topic as Read
- Float this Topic for Current User
- Bookmark
- Subscribe
- Mute
- Printer Friendly Page
Tomcat JDBC connection pool monitoring.
- Mark as New
- Bookmark
- Subscribe
- Mute
- Subscribe to RSS Feed
- Permalink
- Report Inappropriate Content
11-22-2018 04:39 AM
Hi Team,
I am unable to capture Tomcat JDBC connection pool details in AppDynamics. I see ThreadPool details, Memory / Heap Details, but not seeing JDBC Connection pool details.
Can you please help suggest what can be the issue here?
Best Regards,
Saurabh
- Mark as New
- Bookmark
- Subscribe
- Mute
- Subscribe to RSS Feed
- Permalink
- Report Inappropriate Content
12-02-2018 10:45 PM
Hi Team,
Any suggestions on the issue please? This issue is going on for quite some time and this would help solve. Need your suggestions please.
Saurabh
- Mark as New
- Bookmark
- Subscribe
- Mute
- Subscribe to RSS Feed
- Permalink
- Report Inappropriate Content
12-03-2018 02:12 AM
Saurabh,
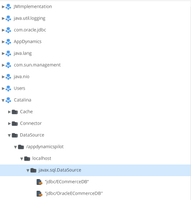
If you brows the MBeans in your Tomcat JVM (either with the AppDynamics MBean browser, or with another tool, such as jconsole) do you see MBeans pertaining to the connection pools?
The out of the box configuration pulls metrics for any MBeans in the Catalina domain matching Catalina:type=DataSource,*
if you see MBeans that should match this, then you will need to investigate why the agent is not reporting metrics based on them. It is probably easiest to drill into this via a support case.
Warm regards,
Peter
Join us on Feb 26 to explore Splunk AppDynamics deployment strategies, SaaS models, agent rollout plans, and expert best practices.
Register Now
Dive into our Community Blog for the Latest Insights and Updates!
Read the blog here
- Troubleshooting AppDynamics Integration with Kubernetes Cluster in Infrastructure (Server, Network, Database)
- Unable to get NodeJS application monitoring to work in Dynamic Languages (Node.JS, Python, PHP, C/C++, Webserver Agent)
- Java Agent - Auto instrument failing the pod in Java (Java Agent, Installation, JVM, and Controller Installation)
- .Net CORE 6 - Implementing AppDynamics in NET (Agent, Installation)
- Spring Boot HikariCP Connection Pool Monitoring in Java (Java Agent, Installation, JVM, and Controller Installation)

Thank you! Your submission has been received!
Thank you! Your submission has been received!
Oops! Something went wrong while submitting the form
