- Community Hub
- Forum Q&A
- Business iQ (Analytics)
- Controller (SaaS, On Premise)
- Dashboards
- Dynamic Languages (Node.JS, Python, PHP, C/C++, Webserver Agent)
- End User Monitoring (EUM)
- Infrastructure (Server, Network, Database)
- Java (Java Agent, Installation, JVM, and Controller Installation)
- Licensing (including Trial)
- .NET (Agent, Installation)
- Privacy and Security
- Smart Agent
- General Discussions
- Resources
- Groups
- Idea Exchange
Not a customer? Click the 'Start a free trial' link to begin a 30-day SaaS trial of our product and to join our community.
Existing Cisco AppDynamics customers should click the 'Sign In' button to authenticate to access the community
- Cisco AppDynamics Community
- Forums Q&A
- Java
- Re: Overall Application Performance(Error/Min) les...
- Subscribe to RSS Feed
- Mark Topic as New
- Mark Topic as Read
- Float this Topic for Current User
- Bookmark
- Subscribe
- Mute
- Printer Friendly Page
Overall Application Performance(Error/Min) less than Errors(Pagenotfound 404(XX_TIER) - Error/Min
- Mark as New
- Bookmark
- Subscribe
- Mute
- Subscribe to RSS Feed
- Permalink
- Report Inappropriate Content
02-22-2018 03:26 AM
Hi ,
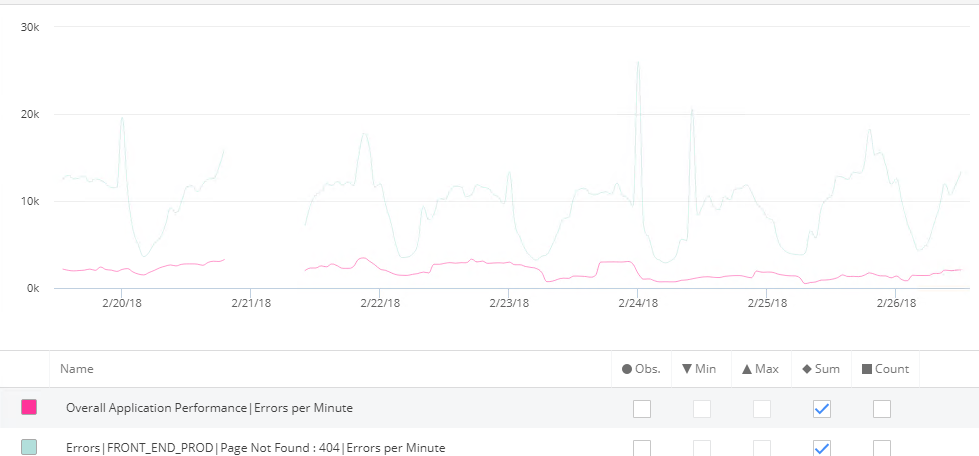
When we plot the graph for Overall Application Performance(Error/Min) less than Errors(Pagenotfound 404(XX_TIER) - Error/Min.
My question is how the Overall Application Perforamance (Sum of all error&Exceptions in application) is less than Particukar tiers page not found 404 error?
Kindly any one help us to understand. how the Error/min calculate on Overall Application Performance and Errors sections.
Please find the below graph. Thanks in Advance!
- Mark as New
- Bookmark
- Subscribe
- Mute
- Subscribe to RSS Feed
- Permalink
- Report Inappropriate Content
02-22-2018 08:09 AM
Can you try to plot the count metric instead of the observed value?
- Mark as New
- Bookmark
- Subscribe
- Mute
- Subscribe to RSS Feed
- Permalink
- Report Inappropriate Content
02-23-2018 10:34 AM
I meant sum* an dnot count.
- Mark as New
- Bookmark
- Subscribe
- Mute
- Subscribe to RSS Feed
- Permalink
- Report Inappropriate Content
02-26-2018 01:46 AM
Hi,
Thanks for your reply!
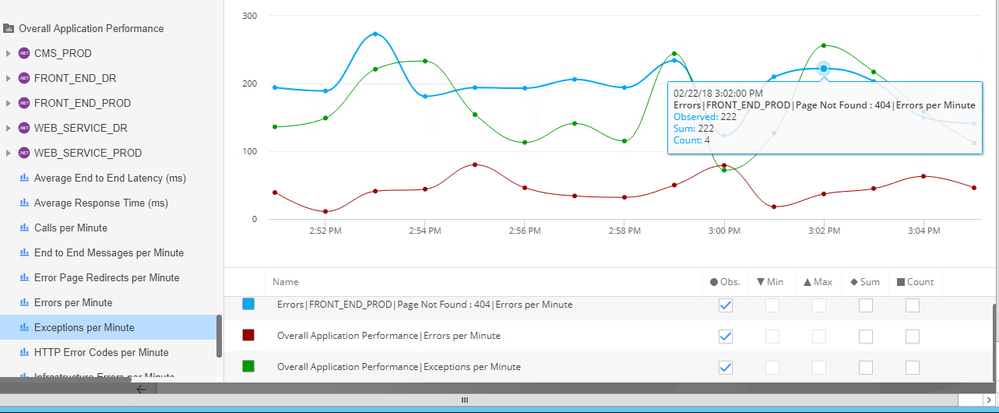
I tried the SUM but now also Overall app performance error > page not found 404(XX_TIER) and here is the screenshot

- Mark as New
- Bookmark
- Subscribe
- Mute
- Subscribe to RSS Feed
- Permalink
- Report Inappropriate Content
02-27-2018 04:28 AM
Hi All,
Below is the answer for my query, hope it helps others as well
Overall Application Performance|Errors per Minute & Overall Application Performance|Exceptions per Minute capture the Errors/Exceptions from the Business Transaction (BT) contexts.
Whereas Errors|<TierName>|<Exception>|Errors per Minute reports the Errors regardless of the BT contexts. Hence these two are not comparable as such. Also the later one can be higher than the other.
https://docs.appdynamics.com/display/PRO43/Errors+and+Exceptions - Refernece Link
Thanks
Soorya Mohan
Learn how Splunk and AppDynamics are redefining observability
Register Now!
Dive into our Community Blog for the Latest Insights and Updates!
Read the blog here
- Enhancing AppDynamics Real User Monitoring for Pega CDH Portal: Challenges with Campaigns and SPA in End User Monitoring (EUM)
- To monitor Java-based microservices running in Docker with AppDynamics in Java (Java Agent, Installation, JVM, and Controller Installation)
- encrpted user credentials for dotnet core in NET (Agent, Installation)
- AppD Java Agent for Web Apps - ClaasNotFound Error in Java (Java Agent, Installation, JVM, and Controller Installation)
- Unable to query the No.of calls of a business transaction in Controller (SaaS, On Premises)

Thank you! Your submission has been received!
Thank you! Your submission has been received!
Oops! Something went wrong while submitting the form
