AppDynamics and batch processing (Springbatch) / performance degradation
- Mark as New
- Bookmark
- Subscribe
- Mute
- Subscribe to RSS Feed
- Permalink
- Report Inappropriate Content
03-21-2018 01:45 AM
Hi Community,
Has any-one experienced a serious performance degradation while monitoring batch processing with AppDynamics? The application we are monitoring is a java app (spring batch) runnning in WebSphere. The batches are being processed with multiple parrallel threads (>10). We see that with AppD monitoring the duration of the batch slows down with a factor 2. We are using appd 4.4.1 and are running in production mode (not in Development Level Monitoring).
This must be a config issue? Anyone had similar issues and how to solve it?
Thanks,
Stijn
- Mark as New
- Bookmark
- Subscribe
- Mute
- Subscribe to RSS Feed
- Permalink
- Report Inappropriate Content
03-21-2018 06:43 AM
Stjin,
That is definitely not expected!
How is the heap sizing? If the JVM was operating close to heap capacity before you introduced the agent, maybe the additional agent memory footprint is now causing frequent Garbage collection?
If that's not the case, then we need to figure out what is consuming the time. Can post some agent logs, either here or in a support ticket?
Warm regards,
Peter
- Mark as New
- Bookmark
- Subscribe
- Mute
- Subscribe to RSS Feed
- Permalink
- Report Inappropriate Content
03-22-2018 06:53 AM
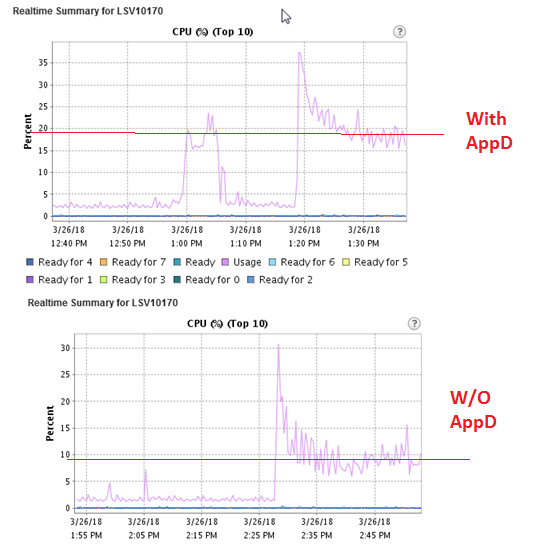
Thanks. First time I've noticed a real difference but I have been mostly involved with online transactional processing (not batch driven processing). We do see a significant overhead of CPU utilisation from AppDynamics (between 5-10%). This drives CPU Busy Time to 100% resulting in batches running way slower. But CPU Busy could be also a symptom of something else. Opening a support ticket and will feed back the result to the community. Hopeful this is just an easy to solve config problem .
Thanks
Stijn
- Mark as New
- Bookmark
- Subscribe
- Mute
- Subscribe to RSS Feed
- Permalink
- Report Inappropriate Content
03-26-2018 06:58 AM
We have done more analysis and we can see that the overhead of AppD for this application is 10% CPU Time. The JAVA App runs in WebShere on a Virtual Machine on an ESX server. Quite classical setup.
- Mark as New
- Bookmark
- Subscribe
- Mute
- Subscribe to RSS Feed
- Permalink
- Report Inappropriate Content
03-27-2018 04:03 AM
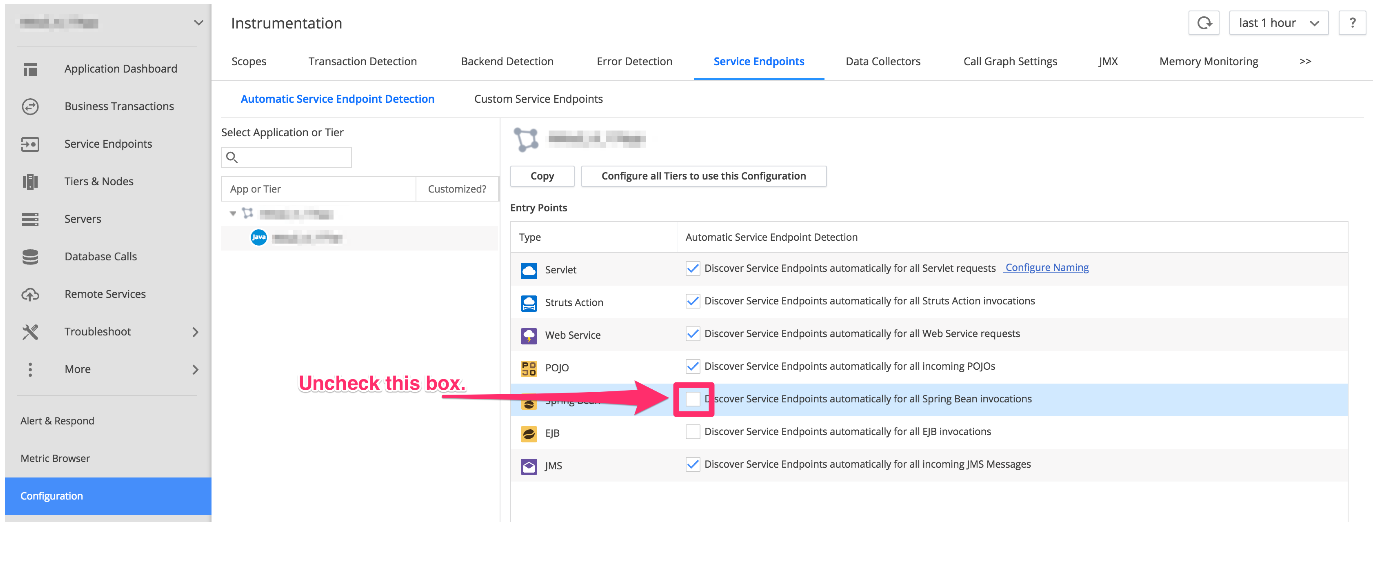
It seems that our selection of Service Endpoints had a dramatic impact on the performance of the application. So be careful when setting these in your instrumentation.... !
- Mark as New
- Bookmark
- Subscribe
- Mute
- Subscribe to RSS Feed
- Permalink
- Report Inappropriate Content
03-27-2018 04:33 AM
This is a very surprising finding to me.
What was your SEP configuration before and after?
- Mark as New
- Bookmark
- Subscribe
- Mute
- Subscribe to RSS Feed
- Permalink
- Report Inappropriate Content
03-27-2018 04:57 AM
We had springbatch included. By disabling the spingbatch option, the duration of a springbatch run was faster and the cpu utilisation decreased. We had 10% overhead with this option which is not acceptable. Suprised as well as the documentation talks about a very slighy difference in CPU utilisation by defining end-points.
- Mark as New
- Bookmark
- Subscribe
- Mute
- Subscribe to RSS Feed
- Permalink
- Report Inappropriate Content
03-27-2018 05:06 AM
Configuration attached
