- Community Hub
- Forum Q&A
- Business iQ (Analytics)
- Controller (SaaS, On Premise)
- Dashboards
- Dynamic Languages (Node.JS, Python, PHP, C/C++, Webserver Agent)
- End User Monitoring (EUM)
- Infrastructure (Server, Network, Database)
- Java (Java Agent, Installation, JVM, and Controller Installation)
- Licensing (including Trial)
- .NET (Agent, Installation)
- Smart Agent
- General Discussions
- Resources
- Groups
- Idea Exchange
Not a customer? Click the 'Start a free trial' link to begin a 30-day SaaS trial of our product and to join our community.
Existing Cisco AppDynamics customers should click the 'Sign In' button to authenticate to access the community
- Cisco AppDynamics Community
- Forums Q&A
- Dashboards
- Re: Machine agent status on Dashboard
- Subscribe to RSS Feed
- Mark Topic as New
- Mark Topic as Read
- Float this Topic for Current User
- Bookmark
- Subscribe
- Mute
- Printer Friendly Page
Machine agent status on Dashboard
- Mark as New
- Bookmark
- Subscribe
- Mute
- Subscribe to RSS Feed
- Permalink
- Report Inappropriate Content
08-14-2018 08:47 AM
Does anyone have any ideas/hints for puting the machine agent status on a dashboard? I cant find it as a selectable metric.
Thanks
- Mark as New
- Bookmark
- Subscribe
- Mute
- Subscribe to RSS Feed
- Permalink
- Report Inappropriate Content
08-14-2018 05:11 PM
Have you tried this one?
JC
- Mark as New
- Bookmark
- Subscribe
- Mute
- Subscribe to RSS Feed
- Permalink
- Report Inappropriate Content
08-14-2018 11:57 PM
Hi
There shuld be a metric in the Metric Browser of the related application that you can use on Custom Dashbaords as well. You don't need SIM enabled for this one.
- Mark as New
- Bookmark
- Subscribe
- Mute
- Subscribe to RSS Feed
- Permalink
- Report Inappropriate Content
08-15-2018 06:46 AM
I tried that but I am unable to get the right percentage to show...I am looking to get the number that displays on the tiers and nodes pages onto a dashboard

- Mark as New
- Bookmark
- Subscribe
- Mute
- Subscribe to RSS Feed
- Permalink
- Report Inappropriate Content
08-16-2018 10:30 AM - edited 08-16-2018 10:50 AM
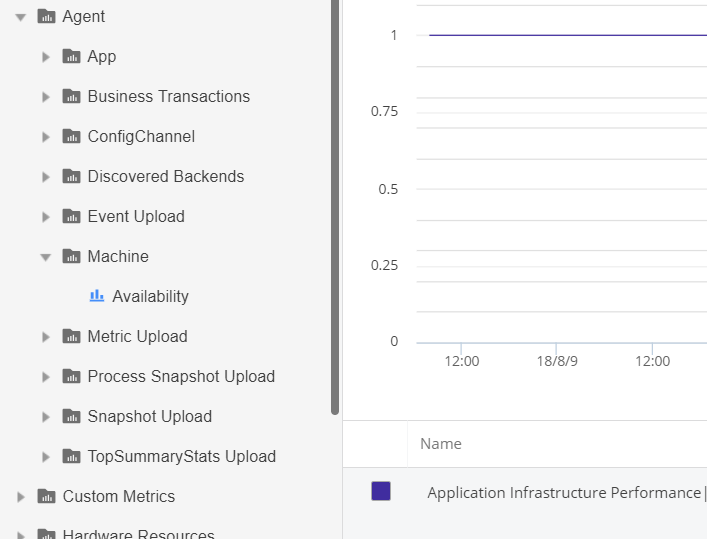
You could chose the guage widget, then choose Tier/Node Health - Hardware, JVM, CLR category. Then choose the tier that contains the machine agents that you want to count. Then for the metric choose Agent|Machine|Availability and hit Save. Then for the Value Range, set the max number of machine agents that you have.
If you just want the metric to show up without the guage, you'll have to use a Metric Expression. It's pretty simple: Create a new Metric Widget, and under Metric to display, choose the tier like above. Then instead of a Single Metric, choose Metric Expression, then Edit Expression.
Click Add Variable. For the metric pick agent|machine|availability, then give it a name of activeAgents. Now under the expression you can calculate the percentage. For example, if there are a total of 7 machine agents that can be active in the tier, you would put:
({activeAgents} / 7) * 100
Now you have a percentage of active machine agents. Hit Save, then under Format String put ${v} % and it will display the value with a percentage at the end of it.
- Mark as New
- Bookmark
- Subscribe
- Mute
- Subscribe to RSS Feed
- Permalink
- Report Inappropriate Content
08-17-2018 12:44 PM
Thanks, but I am looking to get the uptime percent of the node onto a dashboard....so if a node had downtime, I would want to see that it was up for 95% of the time. I can see if listed in the tiers/nodes portion but cant figure out how to get it onto the dashboard
Learn how Splunk and AppDynamics are redefining observability
Watch Now!
Dive into our Community Blog for the Latest Insights and Updates!
Read the blog here
- Server details are not available for the respective Applications in Infrastructure (Server, Network, Database)
- Dot Net Agent not loading the tier in NET (Agent, Installation)
- Dot net agent status at 100% after deleting .Net and machine agent. in NET (Agent, Installation)
- Could not initialize class com.sun.jna.Native STIG RHEL 8 in Infrastructure (Server, Network, Database)
- Help with Machine Agent error in Infrastructure (Server, Network, Database)

Thank you! Your submission has been received!
Thank you! Your submission has been received!
Oops! Something went wrong while submitting the form
