- Community Hub
- Forum Q&A
- Business iQ (Analytics)
- Cisco Cloud Observability
- Controller (SaaS, On Premise)
- Dashboards
- Dynamic Languages (Node.JS, Python, PHP, C/C++, Webserver Agent)
- End User Monitoring (EUM)
- Infrastructure (Server, Network, Database)
- Java (Java Agent, Installation, JVM, and Controller Installation)
- Licensing (including Trial)
- .NET (Agent, Installation)
- Privacy and Security
- Smart Agent
- General Discussions
- Resources
- Groups
- Idea Exchange
Not a customer? Click the 'Start a free trial' link to begin a 30-day SaaS trial of our product and to join our community.
Existing Cisco AppDynamics customers should click the 'Sign In' button to authenticate to access the community
- Cisco AppDynamics Community
- Forums Q&A
- Dashboards
- Re: JMX active session metrics is not visible
- Subscribe to RSS Feed
- Mark Topic as New
- Mark Topic as Read
- Float this Topic for Current User
- Bookmark
- Subscribe
- Mute
- Printer Friendly Page
JMX active session metrics is not visible
- Mark as New
- Bookmark
- Subscribe
- Mute
- Subscribe to RSS Feed
- Permalink
- Report Inappropriate Content
10-04-2018 10:59 PM
We have configured the JMX session in appdynamics . earlier appd used to show this metrics but not now ..
there was some change in jboss and some software ..
we want to know what are the possibilities that appd is not showing this metrics
- Mark as New
- Bookmark
- Subscribe
- Mute
- Subscribe to RSS Feed
- Permalink
- Report Inappropriate Content
10-05-2018 10:47 AM
Sorry to hear that you are experiencing issue locating JMX active session metrics.
To investigate closely, we need information such as the version of your Controller and the Agent.
Please update the thread with necessary information.
- Mark as New
- Bookmark
- Subscribe
- Mute
- Subscribe to RSS Feed
- Permalink
- Report Inappropriate Content
10-07-2018 10:41 PM
HI Radhika ,
Find information as below :
AppDynamics Version 4.4.3.4, build 278
Server Agent #4.5.0.23604 v4.5.0 GA compatible with 4.4.1.0 r88b53d319a45abc58963be9d2d0824499a2c23dd release/4.5.0-release
JVM version :
Java HotSpot(TM) 64-Bit Server VM 1.5.0_14 Sun Microsystems Inc.
- Mark as New
- Bookmark
- Subscribe
- Mute
- Subscribe to RSS Feed
- Permalink
- Report Inappropriate Content
10-08-2018 12:21 PM - edited 10-09-2018 01:14 PM
Thank you for sharing the details.
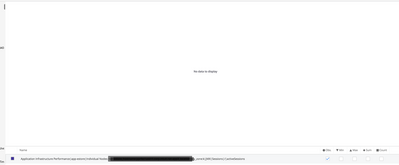
From the screenshots, it appears that there are no metrics in the metrics browser.
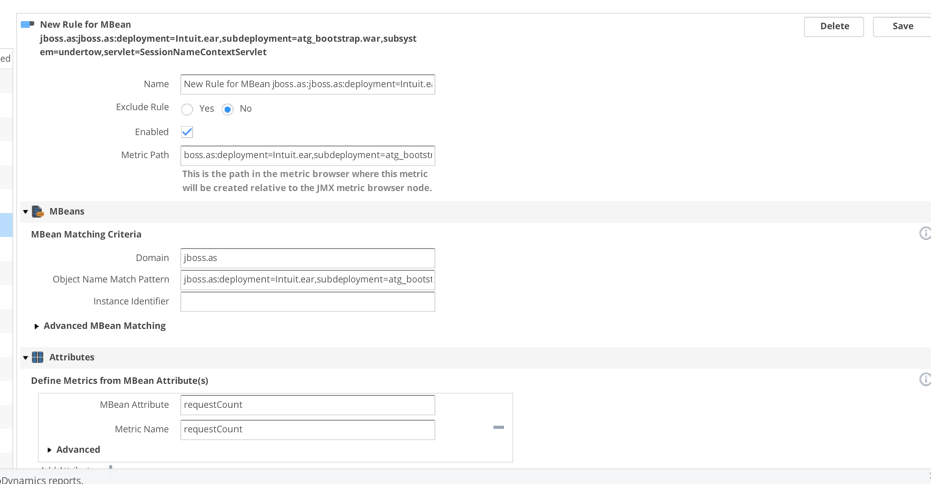
Please see if the metrics are visible in the Mbean browser within the Controller. If you are able to see them, it could be a configuration issue. Please use correct JMX rules to identify the metrics. For more information, see Monitoring JMX documentation.
Metrics not being visible on the browser indicates the agent is not reporting, and without looking at logs we can't give you a definite answer why they are not reporting. For this we need the agent debug logs to troubleshoot. You might also need configuration help, and in this case, it's best to open a support case with agent debug logs from one of the nodes along with the description in the post.
Hope it helps. Let us know how it goes.
- Mark as New
- Bookmark
- Subscribe
- Mute
- Subscribe to RSS Feed
- Permalink
- Report Inappropriate Content
10-09-2018 03:31 AM
Thank you Radhika for your reply ..
1. I have configured mbean but not sure how to see this values in metric browser
2. I am not aware how to open support case to send you appd agent logs .
- Mark as New
- Bookmark
- Subscribe
- Mute
- Subscribe to RSS Feed
- Permalink
- Report Inappropriate Content
10-09-2018 01:18 PM
Please see the knowledgebase article for instruction on locating the Mbean browser.
For information on contacting support, see the Customer Support Resource docs.
Hope it helps. Let us know how it goes.
- Mark as New
- Bookmark
- Subscribe
- Mute
- Subscribe to RSS Feed
- Permalink
- Report Inappropriate Content
02-05-2019 07:15 AM
We have a very similiar issue
We can find the Mbean
We can the JMX Session Metrics in the Metric Browser.
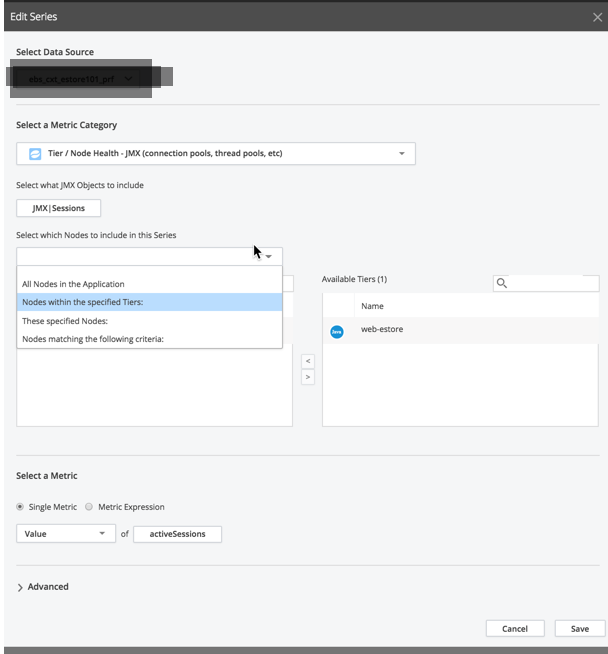
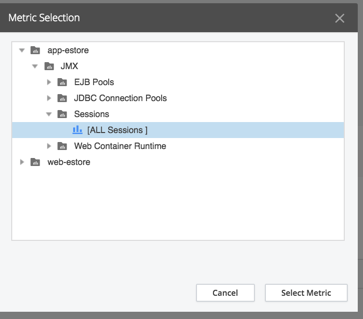
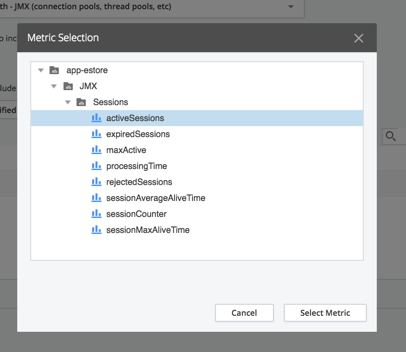
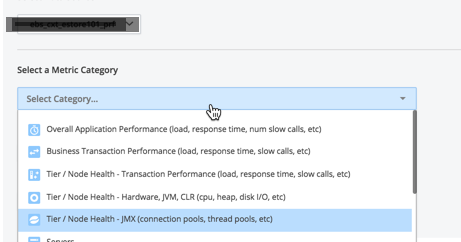
We just cannot see select them from within the the Dashboard Metric Selector.
Discover new Splunk integrations and AI innovations for Cisco AppDynamics.
Register Now!
Dive into our Community Blog for the Latest Insights and Updates!
Read the blog here
- Help needed with setting Up EUM Browser metrics dashboard in AppDynamics in Dashboards
- Cloud PostgreSQL Health Check monitoring in Cisco Cloud Observability
- JMX metric not visible in Metric browser in Java (Java Agent, Installation, JVM, and Controller Installation)
- Default metrics are not visible but server is visible and connected to server in Dashboards
- Controller has Data on Infrastructure metrics under Application, Metric explorer was not populating graph in Infrastructure (Server, Network, Database)

Thank you! Your submission has been received!
Thank you! Your submission has been received!
Oops! Something went wrong while submitting the form
