- Community Hub
- Forum Q&A
- Business iQ (Analytics)
- Controller (SaaS, On Premise)
- Dashboards
- Dynamic Languages (Node.JS, Python, PHP, C/C++, Webserver Agent)
- End User Monitoring (EUM)
- Infrastructure (Server, Network, Database)
- Java (Java Agent, Installation, JVM, and Controller Installation)
- Licensing (including Trial)
- .NET (Agent, Installation)
- Smart Agent
- General Discussions
- Resources
- Groups
- Idea Exchange
Not a customer? Click the 'Start a free trial' link to begin a 30-day SaaS trial of our product and to join our community.
Existing Cisco AppDynamics customers should click the 'Sign In' button to authenticate to access the community
- Cisco AppDynamics Community
- Forums Q&A
- Dashboards
- Re: Health rule not triggering
- Subscribe to RSS Feed
- Mark Topic as New
- Mark Topic as Read
- Float this Topic for Current User
- Bookmark
- Subscribe
- Mute
- Printer Friendly Page
Health rule not triggering
- Mark as New
- Bookmark
- Subscribe
- Mute
- Subscribe to RSS Feed
- Permalink
- Report Inappropriate Content
12-02-2020 12:54 AM - last edited on 12-02-2020 10:26 AM by Ryan.Paredez
Hello
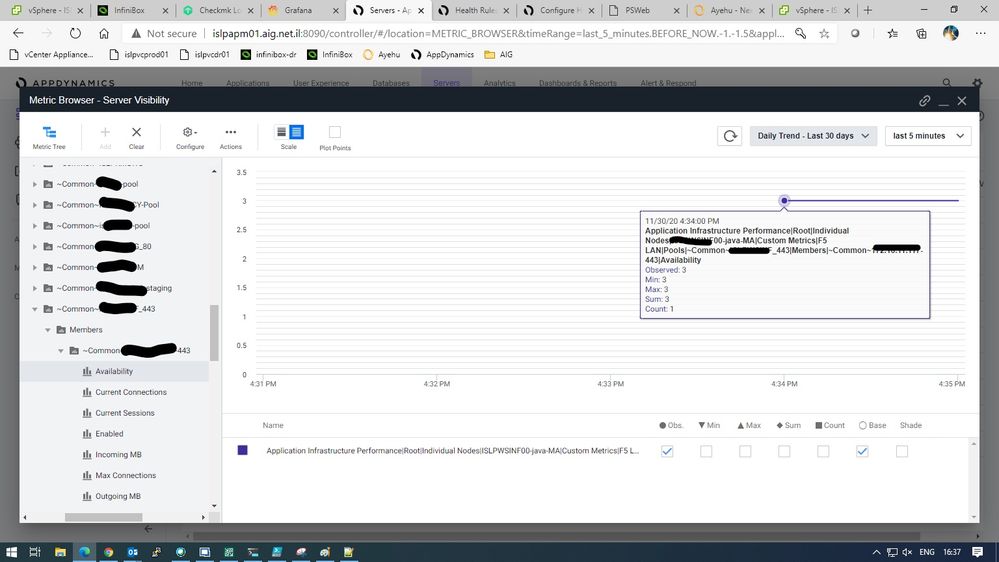
In order to create a F5 availability dashboard I installed the F5 extension which is working fine and shows data as expected.
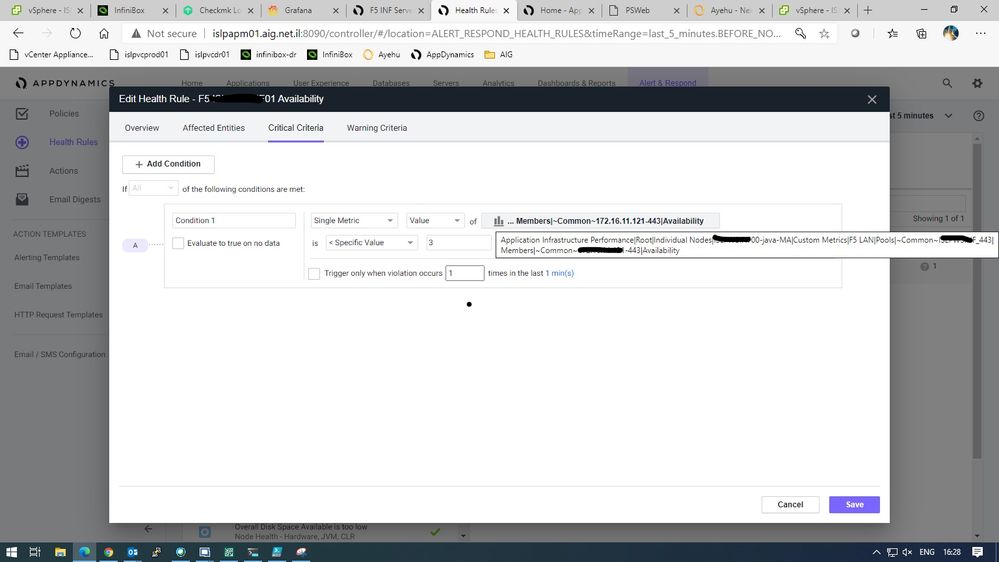
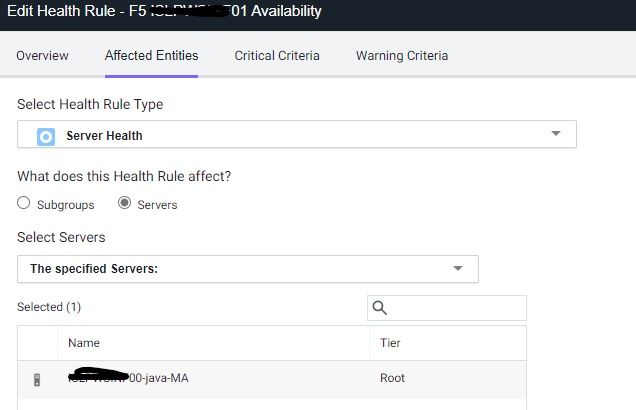
I created a custom health rule for F5 extension. the extension works fine and I can see the data successfully in the "metric browser".
however after I created a health rule for a specific metric, the health rule doesnt work and is always grayed with "?"
the metric Im trying to monitor is:
Application Infrastructure Performance|Root|Individual Nodes|node00-java-MA|Custom Metrics|F5 LAN|Pools|~Common~vipaaa_443|Members|~Common~172.16.10.10-443|Availability
any idea ? please assist
thanks
- Mark as New
- Bookmark
- Subscribe
- Mute
- Subscribe to RSS Feed
- Permalink
- Report Inappropriate Content
01-09-2021 12:50 AM
Hello Tamir,
In the Critical Condition of the Health Rule, use the relative path as "Custom Metrics|F5 LAN|Pools|~Common~vipaaa_443|Members|~Common~172.16.10.10-443|Availability" instead of using the below:
Application Infrastructure Performance|Root|Individual Nodes|node00-java-MA|Custom Metrics|F5 LAN|Pools|~Common~vipaaa_443|Members|~Common~172.16.10.10-443|Availability
Join us on Feb 26 to explore Splunk AppDynamics deployment strategies, SaaS models, agent rollout plans, and expert best practices.
Register Now
Dive into our Community Blog for the Latest Insights and Updates!
Read the blog here
- Help for configuring Health Rule schedule in General Discussions
- How do i capture the current threshold value configured and value that was observed. in Business iQ (Analytics)
- My problem with baselines and moving averages ingesting bad data in Controller (SaaS, On Premises)
- AppDynamics Health Rule Violation Alerts Not Triggered for All Nodes in Slack in Controller (SaaS, On Premises)
- Is it possible to set multiple schedules to a Health Rule in Controller (SaaS, On Premises)

Thank you! Your submission has been received!
Thank you! Your submission has been received!
Oops! Something went wrong while submitting the form


