- Community Hub
- Forum Q&A
- Business iQ (Analytics)
- Controller (SaaS, On Premise)
- Dashboards
- Dynamic Languages (Node.JS, Python, PHP, C/C++, Webserver Agent)
- End User Monitoring (EUM)
- Infrastructure (Server, Network, Database)
- Java (Java Agent, Installation, JVM, and Controller Installation)
- Licensing (including Trial)
- .NET (Agent, Installation)
- Smart Agent
- General Discussions
- Resources
- Groups
- Idea Exchange
Not a customer? Click the 'Start a free trial' link to begin a 30-day SaaS trial of our product and to join our community.
Existing Cisco AppDynamics customers should click the 'Sign In' button to authenticate to access the community
- Cisco AppDynamics Community
- Resources
- Share a tip
- Correlating VMware Servers with Cisco AppDynamics
- Subscribe to RSS Feed
- Mark Topic as New
- Mark Topic as Read
- Float this Topic for Current User
- Bookmark
- Subscribe
- Mute
- Printer Friendly Page
Correlating VMware Servers with Cisco AppDynamics
- Mark as New
- Bookmark
- Subscribe
- Mute
- Subscribe to RSS Feed
- Permalink
- Report Inappropriate Content
04-03-2024 11:30 AM - edited 04-03-2024 11:32 AM
Introduction
In my role as a specialist in observability and system monitoring, I am constantly faced with the challenge of providing effective solutions that meet my clients' needs. In pursuit of this mission, I encountered the opportunity to integrate VMware information with monitoring data from Cisco AppDynamics. In this article, I detail the step-by-step process of my experience implementing this solution in client systems.
Step 1: Understanding the Need
Firstly, I analyzed the clients' demand for more granular monitoring that could link the performance of applications with VMware's virtual and physical infrastructure. The Machine Agent allows for the execution of extensions, and so I utilized an extension called "AppDynamics VMware Tag Extension" which automatically creates tags on Cisco AppDynamics objects, such as Servers, Applications, Tiers and Nodes, with detailed information of the VMware virtual and physical infrastructure. This facilitates the correlation between the performance of the applications and the virtual/physical infrastructure.
The second functionality of the extension is to indicate through tags if there have been migrations of virtual machines (vMotion). Should this occur, tags are also created with information about the source and destination hosts, as well as the date and time of the migration.
Lastly, the extension is also capable of publishing metrics on server (host) consumption. Like other metrics in Cisco AppDynamics, these also benefit from the dynamic baseline feature, providing a more precise and adaptive analysis of server behavior over time.
Step 2: Laying the Groundwork
To ensure a successful implementation, we need to secure all prerequisites:
- An active AppDynamics account;
- A user with read permission for accessing the VMware APIs;
- The server running the Machine Agent must have at least 4 vCPUs and 8 GB of RAM;
- Java 17 or higher;
- Maven
Step 3: Cloning the Repository
There are two ways to proceed with executing the extension: the first involves cloning the repository and compiling the source code locally; the second option allows you to simply download the already compiled and ready-to-use extension.
To clone the repository, open the terminal in your environment and execute the following command to clone the extension repository:
git clone https://github.com/FHDumont/appdynamics-vmware-tag-extension.git
To download the already compiled extension, visit the link https://github.com/FHDumont/appdynamics-vmware-tag-extension/releases and select the ZIP file of the latest version.
Step 4: Compiling the Extension
If you chose the first option in step 3, then use Maven to compile the project and generate the final artifact. In the project directory, execute the following command:
mvn clean install
Step 5: Installing the Extension in AppDynamics
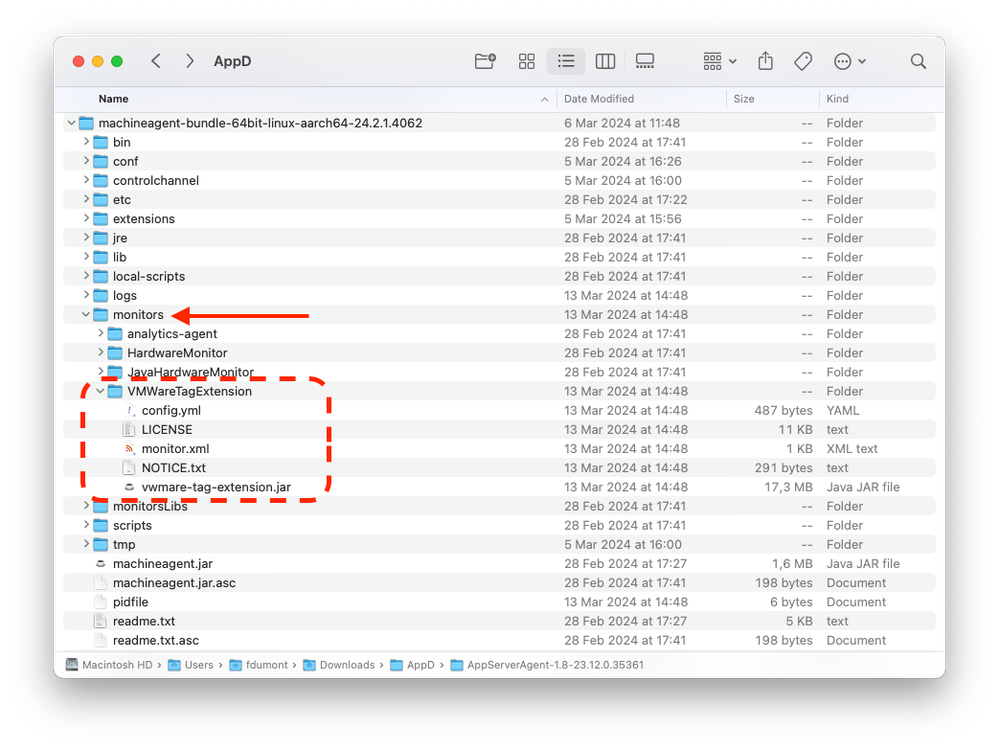
With the extension compiled, unzip the VMWareTagExtension.zip file created in the target directory, or use the pre-compiled extension downloaded in step 3. Copy it to the monitors directory of your Machine Agent. The result should look similar to the structure shown below:
Step 6: Configuring the Extension
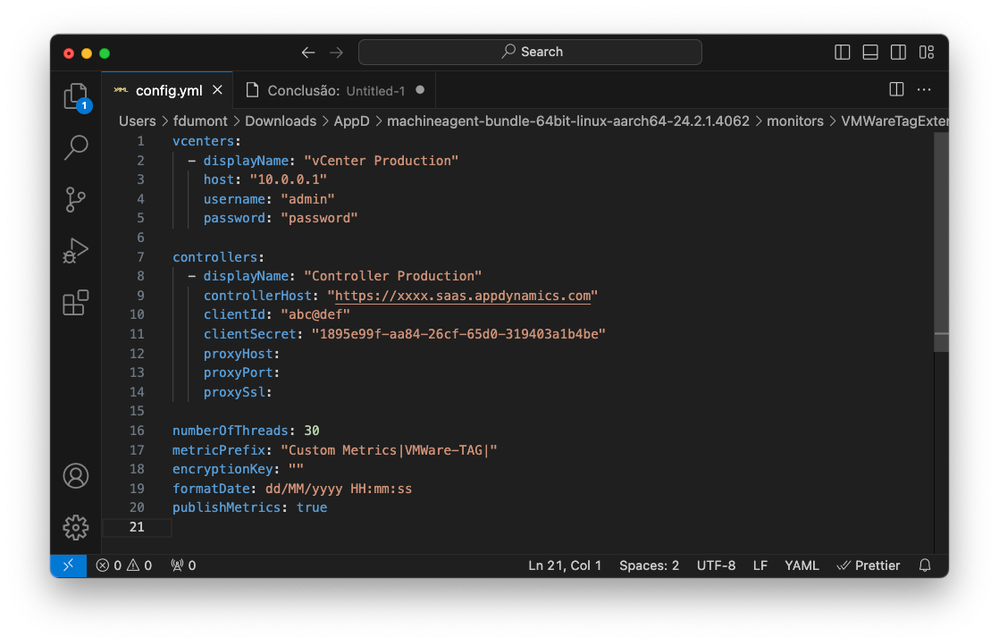
Navigate to the extension's directory and open the file config.yml. Here, you will need to input the necessary configuration information, such as the access credentials for your VMware and AppDynamics environments. Below is an example of the expected configuration setup:
As you correctly pointed out, the clientId and clientSecret are not the same as the login credentials for Cisco AppDynamics. Instead, they refer to authentication tokens used to make API calls. These tokens are specifically created for use in conjunction with the extension and are essential to ensure secure communication with the AppDynamics API.
If you have not yet configured an API client, it is necessary to follow the instructions in the official documentation to create your own clientId and clientSecret. Here's how you can proceed with creating API tokens based on the official documentation.
Remember, these credentials are sensitive and should be treated like any other security information. Do not share your clientId and clientSecret publicly or with unauthorized third parties.
Regarding the publishMetrics property, when it is set to true, this indicates that the extension will publish metrics related to the physical servers (hosts), providing detailed data on the performance and resource usage of these servers in the monitored environment. This enables more comprehensive monitoring and can aid in diagnosing issues, optimizing resource allocation, and ensuring that applications run efficiently on the underlying infrastructure.
Step 7: Checking the Results
The time it takes to correlate the hosts with the servers monitored by the Machine Agent varies and is influenced by the total number of hosts, virtual machines, and servers under monitoring. Depending on the complexity and size of the environment, this process can be quite rapid, taking just a few seconds, or it may require more time, extending over several minutes.
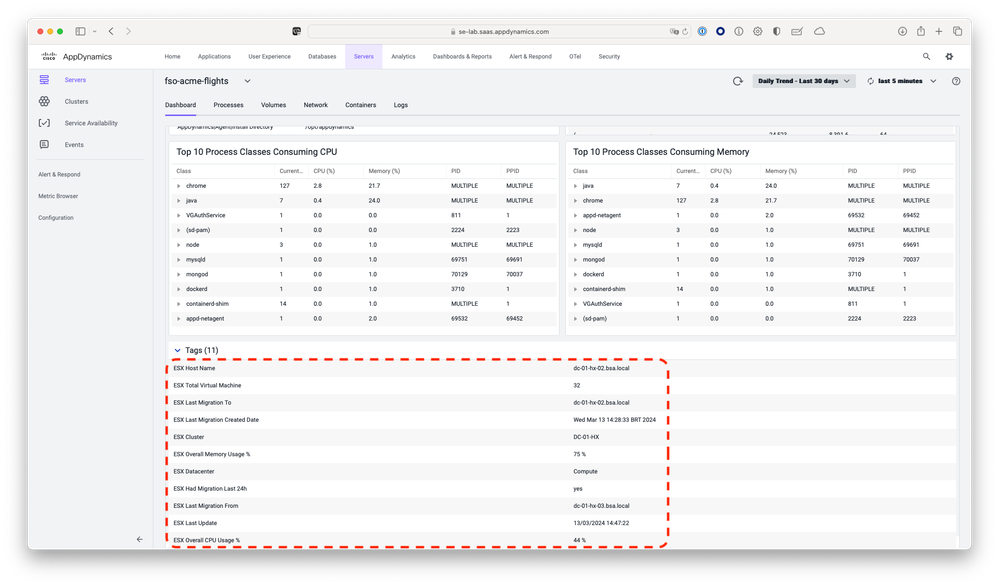
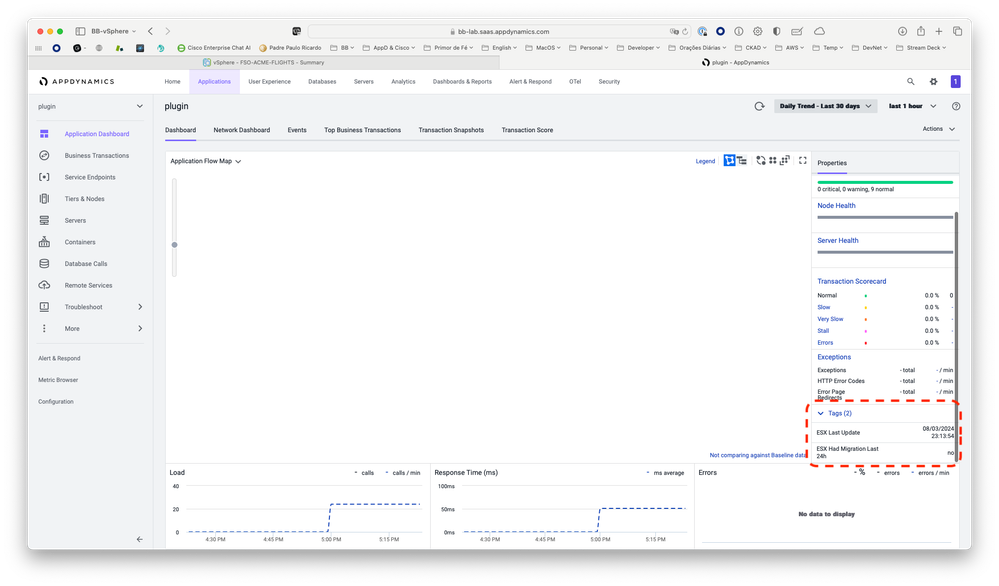
No additional actions are needed to obtain the results; one simply has to wait for the process to complete. Once finished, the correlated information will be available and can be verified through the provided visualizations, as illustrated in the following images.
The following tags will be created on the servers and nodes:
- ESX Cluster
- ESX Datacenter
- ESX Host Name
- ESX Overall CPU Usage %
- ESX Overall Memory Usage %
- ESX Total Virtual Machine
- ESX Had Migration Last 24h
- ESX Last Migration Created Date
- ESX Last Migration From
- ESX Last Migration To
- ESX Last Update
These tags facilitate a detailed understanding of the relationship between application performance and the underlying infrastructure. They allow for easier identification of potential issues and provide essential data for capacity planning and performance tuning. Users will be able to view these tags within the AppDynamics interface and use them to sort, filter, and analyze the performance data collected from their VMware infrastructure.
The following tags will be created for applications and tiers:
- ESX Had Migration Last 24h
- ESX Last Update
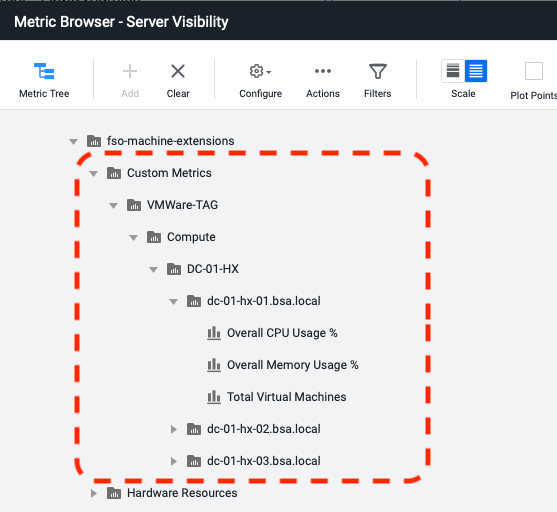
The metrics listed below will be generated for each physical server detected and published to the AppDynamics controller configured in the Machine Agent. These metrics will be organized in a hierarchical structure that reflects the layout of the datacenter, the cluster, and the host itself:
Conclusion
The AppDynamics VMware Tag Extension is a powerful tool for those utilizing the combination of AppDynamics and VMware, providing an integrated and detailed view of application performance and virtual infrastructure. By following the steps outlined above, you will be able to successfully install and configure the extension, significantly enhancing the monitoring of your environment.
Remember to consult the official documentation and the GitHub repository for up-to-date and detailed information about the configuration and potential issues during installation. With the extension configured, your IT operations team will be better equipped to detect and resolve performance issues, ensuring quality service for end users.
References
Official extension link:
LinkedIn:
Author's official website:
- Infrastructure Based Licensing in Knowledge Base
- Setting up Redis and Monitoring with Splunk AppDynamics in Knowledge Base
- Setting up RabbitMQ and Monitoring with Splunk AppDynamics in Knowledge Base
- Using Python's Built-in HTTP Server to Host Cisco AppDynamics Smart Agent Installation Files in Knowledge Base
- Troubleshooting Incomplete Metric Reporting in SIM Machine Agents for Server Visibility in Knowledge Base

Thank you! Your submission has been received!
Thank you! Your submission has been received!
Oops! Something went wrong while submitting the form
